Introduction
In computer graphics, we have two primary approaches to representing graphical information, raster and vector representations.
Raster graphics take their name from the scan pattern of a cathode-ray tube, such as was used in older television sets and computer monitors. These, as well as modern monitors, rely on a regular grid of pixels composed of three colors of light (red, green, and blue) that are mixed at different intensities to create all colors of the visible spectrum.
Cathode Ray Tube
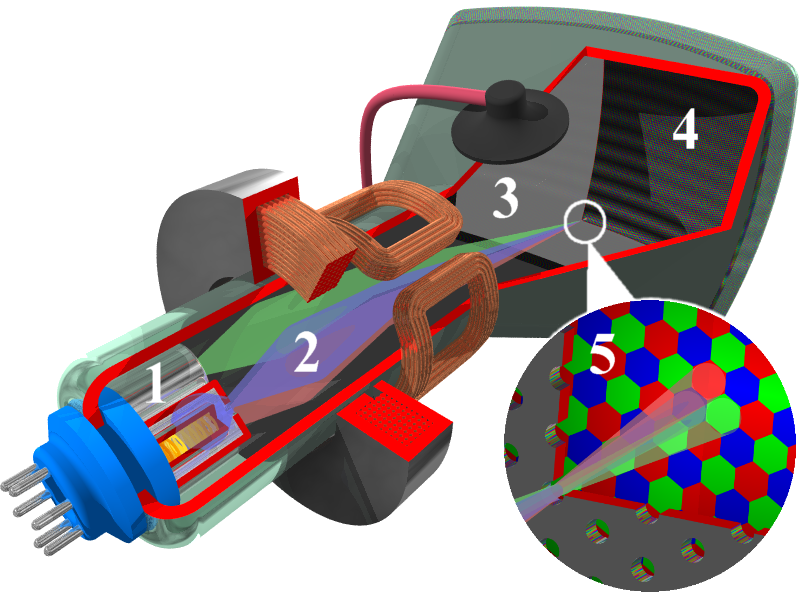
A cathode ray tube (CRT) screen works by firing electrons out of an electron gun (1) through electromagnetic coils (2) that steer them through a perforated mask (3) that separates the electrons corresponding to the red, green, and blue components of an individual pixels. These electrons then strike the phosphor-coated back of the screen (4), causing it to emit photons of a particular wavelength.Image courtesy of Søren Peo Pedersen, made available through the creative commons share-alike 3.0 license.
This inheritance from CRT monitors is important, because it affects several details about how computer graphics are implemented. Because CRT screens blend three colors of light (red, green, and blue) at different intensities, they needed to be supplied these intensities, and they needed to be grouped together into single pixels, as the electron gun can only light up a single cluster of phosphorus dots at once. The illusion of a continuous image is generated because the electron beam scans across the back of the screen so rapidly that the pixels appear to be constantly lit.
The scanning pattern the electron beam takes begins at the upper left corner of the screen, and sweeps from left to right. When the right edge of the screen is reached, then the beam drops to the next row, and again scans left to right. This continues until the lower right corner is reached, at which point the beam begins back in the upper left-hand corner - just like reading a book in the English language. CRT screens were first used in analog televisions, which receive a continuous signal that streams pixel intensities, so this made a lot of sense to the engineers designing them. When computers first started needing monitors, the existing CRT technology was adapted to fit them - as a result, in computer graphics, the origin is in the upper left corner of the screen, and the y-axis increases in a downward direction:
Image taken from inetjava.sourceforge.net and believed to be public domain.
Warning
The origin being located in the upper-left corner and the Y-axis increasing in a downward direction sometimes confuses novice programmers, who expect the origin to be in the lower right corner and the y-axis to increase in an upward direction, as is the case in Euclidean geometry.
Additionally, early computers needed a location to store what should be displayed on the screen, which the computer’s VGA card could then continuously stream from to correctly display on-screen. This video memory consisted of a linear array of pixel data - each pixel was typically represented by three eight-bit numbers corresponding to the intensity of the red, green, and blue for each pixel. Thus, each intensity would range from 0 (fully off) to 255 (fully on; remember, $2^8 = 256$). This was, in the early days of computers, quite memory-consumptive (a VGA monitor would use 640 x 489 x 3 bytes, or 900 kilobytes to hold the screen’s data), so many early graphics cards supported alternative graphics modes used a color lookup table and kept corresponding indices in the linear array. While this is no longer common in modern computer equipment, some simple embedded systems still utilize these kinds of video modes.