Debugging & Logging
Fixing bugs & taking notes!
Fixing bugs & taking notes!
We’ve already spent quite a bit of time learning how to write code for our programs. But, what if something goes wrong? How can we fix it?
Unfortunately, it is nearly impossible to write a computer program that doesn’t contain any bugs. In fact, it is a common joke among programmers that the only truly bug-free program you’ll ever write is the classic “Hello World” program! So, we’ll need to have some tools at our disposal that we can use to find and fix the various bugs or errors in our code.
In this chapter, we’ll briefly discuss some of the concepts and techniques that we can use to explore and debug our code. In this chapter, we’ll introduce the following concepts:
First, let’s briefly discuss the art of debugging. Finding and fixing bugs in a complex piece of software is indeed an art, meaning that it something that takes a great amount of skill that comes with practice. So, how can we get better at this? Here are some tips. Much of this content was inspired by the talk The Art of Debugging by Remy Sharp.
This seems pretty obvious, but as we’ve discussed several times in this course, software bugs can be very costly to fix, and the longer they remain in the source code, the harder they can be to fix. So, as a developer, it is important for us to always focus on writing code that is free of any obvious bugs and errors.
If we take the time to think clearly about our code, trace it out on paper or in our head, and maybe even write small little test programs to make sure the code behaves the way we expect it to, we can greatly reduce the amount of simple bugs that get included in our programs. Even simple logic errors such as the classic “off by one” error (where we forget to properly handle the last item in an array) or more complex issues such as floating-point errors can be discovered and dealt with quickly by a programmer who is consciously thinking about how the code will be used and how it might fail.
Unfortunately, if a bug is introduced, we can follow a three step process to find and fix the bug.
The first step in debugging is figuring out how to consistently reproduce the bug. For example, say a customer complains that our point of sale application crashes once every few days. There could be all sorts of reasons why that might happen, and based on that information, it can be really difficult to tell what is going on.
However, with a bit more digging, we might find out that the customer only sells hot dogs on Fridays, and those are the days that the application crashes. That might give us a clue that something related to hot dogs might be the culprit.
So, we can start working with our program and figuring out exactly what causes the application to crash. Hopefully, we’ll be able to figure out a minimum set of steps or a short piece of sample code that can trigger the exact bug we are looking for. Once we are in a position to effectively reproduce the bug, we can start fixing it.
At this point, we know how to cause the bug, but we still may not know exactly why the bug is occurring, nor what piece of code is causing it. So, we’ll need to continually reproduce the bug while inspecting our program to determine the root cause. At this point, we can use several tools such as debuggers and stack traces to see exactly what is going on when the program crashes. We can also examine logs of data created by our program.
Finally, one of the simplest but surprisingly powerful methods of isolating a bug is to add some additional debugging code to our program, and then engage in a virtual “binary search” process to determine where the bug is. If the code reaches our debugging code before it crashes, we know that the bug occurs after that point in our program. While it may seem rudimentary, it can be a very powerful technique.
Once we have identified the location of bug, we can work on fixing it. At this point, one of the most powerful things we can do is write a unit test that causes the bug. We can use special methods in our unit test to assert that the code should or should not throw an exception, depending on how it should operate.
Then, once we are sure our unit test will cause the bug, we can set about trying to fix it. This could involve some careful coding to either catch the specific case that causes the bug, or we may have to more generally refactor or restructure our code a bit to deal with larger errors.
Once we believe we’ve fixed the bug, we can run our unit test to confirm that it is no longer present in our code. At that point, we may also want to run all of our unit tests as a form of regression testing to make sure that our fix for this bug didn’t introduce any new bugs as well.
If everything looks good, then we can work on deploying the new version of our application, hopefully with at least one fewer bug!
Object in our object-oriented programs can really be thought of as two different parts - the state and behavior of the object. When debugging, we may need to consider both parts of the object to determine what is really going on behind the scenes. So, let’s look at some ways we can explore the state of our program.
The quickest and easiest way to explore the state of our program at any particular point during its execution is to simply add a print statement that prints the value of any variables we are interested in.
Many times we are dealing with objects that we’ve created, and printing them directly may not be very useful. So, it is very important for us to develop useful string representations of our objects that we can use when debugging. In Java, we can override the default toString() method for this. In Python, we have both the __str__() method that is used when printing, as well as the more complex __repr__() method that typically gives more information.
When printing this information, it is helpful to include additional information along with the value of the variable, such as the function and even the line of code where the statement is located:
TestCode:5 - a=5 b=6 c=7As we’ll see later in this chapter, we can also do this automatically when we use a logger along with our program.
Sometimes, we may only want to print our program’s state when a particular situation occurs. In that case, we can simply wrap our print statements in a conditional statement, or if statement, that checks for the desired condition. This helps minimize the amount of data we have to sort through to pinpoint our error.
While this may seem pretty obvious, its important to remember that we can use the same simple tools we use when building a program to debug that program as well.
As a last resort, we may wish to force our program to have a particular state to help us isolate a bug. This is best accomplished through a unit test, since we can call individual functions with the exact values we need.
Later in this chapter, we’ll learn about one more tool we can use to inspect state - a debugger!
We may also wish to inspect the behavior of our program that could lead to a particular error. Specifically, we may need to know what set of function calls and classes lead to the error itself. In that case, we’ll need a way to see what code was executed before the bug was reached.
One of the most useful ways to inspect the behavior of our application is to look at the call stack or stack trace of the program when it reaches an exception. The call stack will list all of the functions currently being executed, even including the individual line numbers of the currently executed piece of code.
For example, consider this code:
public class Test {

    public void functionA() throws Exception{
        this.functionB();
    }

    public void functionB() throws Exception{
        this.functionC();
    }

    public void functionC() throws Exception{
        throw new Exception("Test Exception");
    }

    public static void main(String[] args) throws Exception{
        Test test = new Test();
        test.functionA();
    }
}
class Test:
def function_a(self) -> None:
self.function_b()
def function_b(self) -> None:
self.function_c()
def function_c(self) -> None:
raise Exception("Test Exception")
Test().function_a()This code includes a chain of three functions, and the innermost function will throw an exception. When we run this code, we’ll get the following error messages:
Exception in thread "main" java.lang.Exception: Test Exception
        at Test.functionC(Test.java:12)
        at Test.functionB(Test.java:8)
        at Test.functionA(Test.java:4)
        at Test.main(Test.java:17)
Traceback (most recent call last):
File "Test.py", line 11, in <module>
Test().function_a()
File "Test.py", line 3, in function_a
self.function_b()
File "Test.py", line 6, in function_b
self.function_c()
File "Test.py", line 9, in function_c
raise Exception("Test Exception")
Exception: Test ExceptionAs we can see, both Java and Python will automatically print a stack trace of the exact functions and lines of code that we executed when we were reaching the error. Recall that this relates to the call stack in memory that is created while this program is executed:
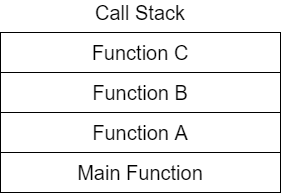
As we can see, Java will print the innermost call at the top of the call stack, whereas Python will invert the order and put the innermost call at the end. So, you’ll have to read carefully to make sure you are interpreting the call stack correctly.
What if we want to get a call stack without crashing our program? Both Java and Python support a method for this:
Thread.dumpStack();traceback.print_stack()In both instances, we just need to import the appropriate library, and we have a method for examining the complex behaviors of our programs at our fingertips. Of course, as we’ll see in a bit, both debuggers and loggers can be used in conjunction with these methods to get even more information from our program.
What if we want to have a bit more control over our programs and use a more powerful tool for finding bugs. In that case, we’ll need to use a debugger. A debugger is a special application that allows us to inspect another program while it is running. Using a debugger, we can inspect both the state and behavior of an application, and observe the program directly while it runs. Most debuggers can also be configured to pause a program at a particular line of code, and then execute each following line one at a time to quickly find the source of the error. Both Java and Python come with debuggers that we can use.
In practice, very few developers use a debugger in a standalone way as described below. Instead, typically the debugger is part of their integrated development environment, or IDE. Using a debugger in an IDE is much simpler than using it via the terminal. At the bottom of this page, we’ll describe how to use the built-in debugger in Codio, which will be a much simpler experience.
The Java debugger jdb is a core part of the Java Software Development Kit (SDK), and is already installed for us in Codio. To use the Java debugger, we have to perform two steps:
-agentlib:jdwp=transport=dt_shmem,server=y,suspend=njdb -attach jdbconnOnce we’ve started a Java debugger session, we can use several commands to control the application. The Java Debugger manual from Oracle gives a good overview of how to use the application.
Python also includes a debugger, called pdb. It can be imported as a library within the code itself, or it can be used as a module when running another script. Similar to the Java debugger, once the debugger is launched, there are many different commands we can use to control the application. The Python Debugger documentation is a great source of information for how to use the Python debugger itself.
Of course, as you might guess, using a debugger directly on the terminal is a very complex, time-consuming, and painful process. Thankfully, most modern integrated development environments, or IDEs, include a graphical interface for various debuggers, and Codio is no exception. Codio includes a built-in debugger that is capable of debugging both Java and Python code.
The Codio Documentation is a great place to learn about how to use the Codio debugger and all of the features it provides. In the example project for this module, we’ll also learn how to quickly integrate a debugger into our larger project in Codio.
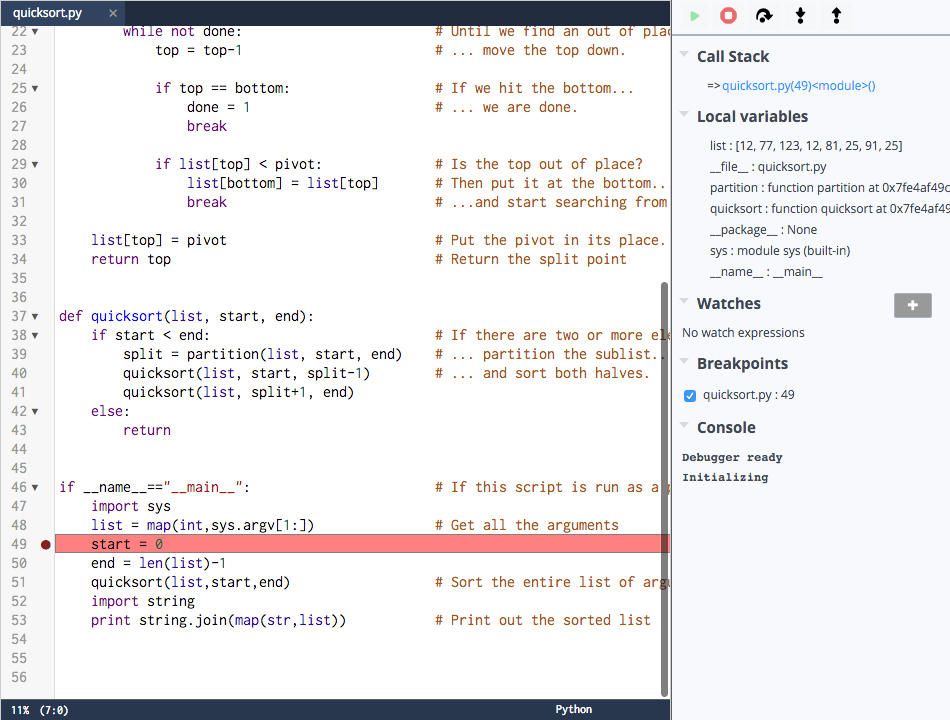
Once the Codio debugger is launched, you’ll be given a view similar to this one:
On the right, we can see the debugging window that lists the current call stack, any local variables that are visible, as well as watches and breakpoints. A breakpoint is a line of code that we’ve marked in the debugger that causes execution to stop, or break, when it reaches that line. Basically, we are telling the debugger that we’d like to execute the program up to that point. Once the program is paused, we can examine the state and call stack, and decide how we’d like to proceed. There are 5 buttons at the top of the debugger panel, and they are described in the Codio documentation2 as follows:
These five buttons are common to most debuggers, so it is very important to get used to them and how they work. Stepping through your code quickly and efficiently using breakpoints and a debugger is an excellent skill to learn!
Unfortunately, one major limitation of the Codio debugger is that it does not allow us to accept input via the terminal while the debugger is running. So, we’ll have to come up with some other way of providing input to our program if we need to debug it.
The easiest way is to write our program to read input from a file where needed. We can then provide the file name as a command-line argument when the program is launched via the debugger. In our code, if a command-line argument is provided, we know we should read from a file. Otherwise, we should just read from the terminal like usual.
We’ve seen how to do this in our code in many of the previous CC courses, so feel free to go back and review some of that code for examples. We’ll also look at how to do this in the example project for this module.
The last major concept we’ll introduce around debugging is the use of a formal logger in our code. A logger allows us to collect debugging information throughout our program in a way that is lightweight, highly configurable, and surprisingly easy to use. Both Java and Python include some standard ways to create a simple log file.
The Java language includes the Logger class that can be used to create a logger within the code. Then, we can define what Level of items we’d like to log, and how we’d like to store it. Typically, it’ll either be stored in a file or just printed to the terminal.
Here’s a very simple example of using a logger in our code:
import java.util.logging.FileHandler;
import java.util.logging.Level;
import java.util.logging.Logger;

public class LogTest {


    private final static Logger LOGGER = Logger.getLogger(Logger.GLOBAL_LOGGER_NAME);

    public static void main(String[] args){
        // Levels INFO, WARNING, and SEVERE will be printed
        LOGGER.setLevel(Level.INFO);
        // Add a file logger
        LOGGER.addHandler(new FileHandler("log.xml"));
        LOGGER.info("This is an info log.");
        LOGGER.warning("This is a warning, but not too bad.");
        LOGGER.severe("This is a severe message, THIS IS BAD!");
    }
}
When this program is executed, we see the following output in the terminal:
Jan 21, 2021 10:14:46 PM LogTest main
INFO: This is an info log.
Jan 21, 2021 10:14:46 PM LogTest main
WARNING: This is a warning, but not too bad.
Jan 21, 2021 10:14:46 PM LogTest main
SEVERE: This is a severe message, THIS IS BAD!
We should also see a new file named log.xml in our current working directory, which contains an XML version of the log information printed to the terminal:
<?xml version="1.0" encoding="UTF-8" standalone="no"?>
<!DOCTYPE log SYSTEM "logger.dtd">
<log>
<record>
  <date>2021-01-21T22:14:46</date>
  <millis>1611267286120</millis>
  <sequence>0</sequence>
  <logger>global</logger>
  <level>INFO</level>
  <class>LogTest</class>
  <method>main</method>
  <thread>1</thread>
  <message>This is an info log.</message>
</record>
<record>
  <date>2021-01-21T22:14:46</date>
  <millis>1611267286139</millis>
  <sequence>1</sequence>
  <logger>global</logger>
  <level>WARNING</level>
  <class>LogTest</class>
  <method>main</method>
  <thread>1</thread>
  <message>This is a warning, but not too bad.</message>
</record>
<record>
  <date>2021-01-21T22:14:46</date>
  <millis>1611267286139</millis>
  <sequence>2</sequence>
  <logger>global</logger>
  <level>SEVERE</level>
  <class>LogTest</class>
  <method>main</method>
  <thread>1</thread>
  <message>This is a severe message, THIS IS BAD!</message>
</record>
</log>
Of course, if we change the level to Level.SEVERE, then only the last message will be printed. We can even turn the log off completely. So, in this way, we can include the logging messages in our code wherever they are needed, and then configure the logger to only print the messages we want, or no messages at all. This is much more flexible than our earlier method of just using print statements, since we don’t have to worry about removing them from our code later on.
The Java language includes the logging library that can be used to create a logger within the code. It includes several common Logging Levels that we can use, and we can easily configure it to log items to the terminal or a file.
Here’s a very simple example of using a logger in our code, adapted from the Logging HOWTO in the Python documentation:
import logging
import sys

class LogTest:

    @staticmethod
    def main():
        # get the root logger
        logger = logging.getLogger()
        # set the log level
        logger.setLevel(logging.INFO)
        # add a terminal logger
        stream_handler = logging.StreamHandler(sys.stderr)
        stream_handler.setFormatter(logging.Formatter("%(asctime)s - %(name)s\n%(levelname)s: %(message)s"))
        logger.addHandler(stream_handler)
        # add a file logger
        file_handler = logging.FileHandler("log.txt")
        file_handler.setFormatter(logging.Formatter("%(asctime)s - %(name)s\n%(levelname)s: %(message)s"))
        logger.addHandler(file_handler)
        logger.info("This is an info log.")
        logger.warning("This is a warning, but not too bad.")
        logger.critical("This is a critical message, THIS IS BAD!")

if __name__ == "__main__":
    LogTest.main()
When this program is executed, we see the following output in the terminal:
2021-01-21 22:33:53,224 - root
INFO: This is an info log.
2021-01-21 22:33:53,224 - root
WARNING: This is a warning, but not too bad.
2021-01-21 22:33:53,225 - root
CRITICAL: This is a critical message, THIS IS BAD!
We should also see a new file named log.txt in our current working directory, which contains the same content.
Of course, if we change the level to logging.CRITICAL, then only the last message will be printed. We can even turn the log off completely. So, in this way, we can include the logging messages in our code wherever they are needed, and then configure the logger to only print the messages we want, or no messages at all. This is much more flexible than our earlier method of just using print statements, since we don’t have to worry about removing them from our code later on.
Now that we know how to create a logger for our program, it should be really simple to convert any existing print statements to logging statements. Then, in the main class of our program, we can simply configure the desired level of logging - we would typically turn it completely off or only allow severe errors to be logged when the application is deployed, but for testing we may want the log to include more information.
This gives us a quick and flexible way to gain information from our code through the use of logging.
In this chapter, we discussed some steps we can take when debugging our applications. When we find a bug, we should try to figure out how to replicate it first, then focus on isolating the bug, and finally fix the bug. While we do so, we can write additional unit tests to reproduce the bug that will help us confirm that we’ve fixed it, and we can perform some regression testing to make sure we didn’t introduce any new errors.
We discussed ways we can inspect the state and behavior of our application. We learned that we can create a call stack or stack trace from our code, giving us insight into exactly what lines of code are being executed at any given time.
We explored the use of debuggers, and saw that Codio has a built-in debugger that we can use in our projects.
Finally, we learned about the logging capabilities that are present in both Java and Python, and how we can convert our simple print statements to logging statements that can easily be turned on, off, or configured as needed.
Check your understanding of the new content introduced in this chapter below - this quiz is not graded and you can retake it as many times as you want.