Debugging C programs
gdb is the C debugger. It allows you to create an executable specifically for debugging purposes.
Getting gdb
First, ensure that you have gdb installed.
gdb on Windows
Type in a terminal:
gdb --versionIf you see a version number, then you already have gdb installed. If you see an error that gdb is unrecognized, you will need to install it. Launch a MSYS2 prompt (Windows icon->type MSYS2) and then type the following in MSYS2:
pacman -S mingw-w64-x86_64-gdbThis should install gdb. Next, you will need to add the gdb.exe location to your Path. It may be in the same location as gcc, which for me is C:\msys64\mingw64\bin, but it may be in a different location. The gdb.exe file should be in a \bin folder somewhere within the C:\msys64 folder - you may need to search for it. Copy the address where you find the gdb.exe file.
Next, add the location of your gdb.exe file to your Path (if it is a different location than your gcc.exe file). Click Start, type Environment variables, and select “Edit the system environment variables”). Click “Environment Variables..”, then find Path under System variables and click “Edit…”. Look to see if the location of your gdb.exe file is already listed – if it is, you don’t need to add anything. If it’s not, click “New”, paste in the address you copied in the previous step, and click OK three times to dismiss each frame.
gdb on Mac
I recommend following this tutorial to get gdb on your machine.
First tutorial
Suppose we have the following program, test.c. This program is supposed to multiply together the numbers 1 * 2 * 3 * 4 * 5, but it has some problems:
| |
First, build an executable with debugging information:
gcc -g test.c -o debugThis will create the executable debug. You can run gdb on debug as follows (this will launch gdb, but will not yet start running your program):
gdb debugYou will see something like:
GNU gdb (GDB) 12.1
Copyright (C) 2022 Free Software Foundation, Inc.
License GPLv3+: GNU GPL version 3 or later <http://gnu.org/licenses/gpl.html>
This is free software: you are free to change and redistribute it.
There is NO WARRANTY, to the extent permitted by law.
Type "show copying" and "show warranty" for details.
This GDB was configured as "x86_64-w64-mingw32".
Type "show configuration" for configuration details.
For bug reporting instructions, please see:
<https://www.gnu.org/software/gdb/bugs/>.
Find the GDB manual and other documentation resources online at:
    <http://www.gnu.org/software/gdb/documentation/>.

For help, type "help".
Type "apropos word" to search for commands related to "word"...
Reading symbols from debug...
(gdb)
That last (gdb) at the end is the debugging prompt.
Before you execute your program in the debugger, you’ll want to set a breakpoint (or several). For example, suppose we want to set a breakpoint at the start of the main function. Then we can type:
break main(We could have also typed break 3, which sets a breakpoint on line 3 – which is the beginning of the main function.) You can add more than one breakpoint in this way.
When we have added our breakpoint(s) and are ready to run our program with debugging, we type at the debugging prompt:
run(If our program accepts command-line arguments, we include them after the run command.) We see:
Starting program: C:\...\debug.exe
[New Thread 9144.0x47d8]

Thread 1 hit Breakpoint 1, main () at test.c:4
4           int prod = 0;
Which tells us that our program has stopped at our breakpoint just before executing line 4 (which is the first statement that performs an operation in our main function). From here, we can graphically view the current line in the program by typing:
layout srcIn this example, we will see:
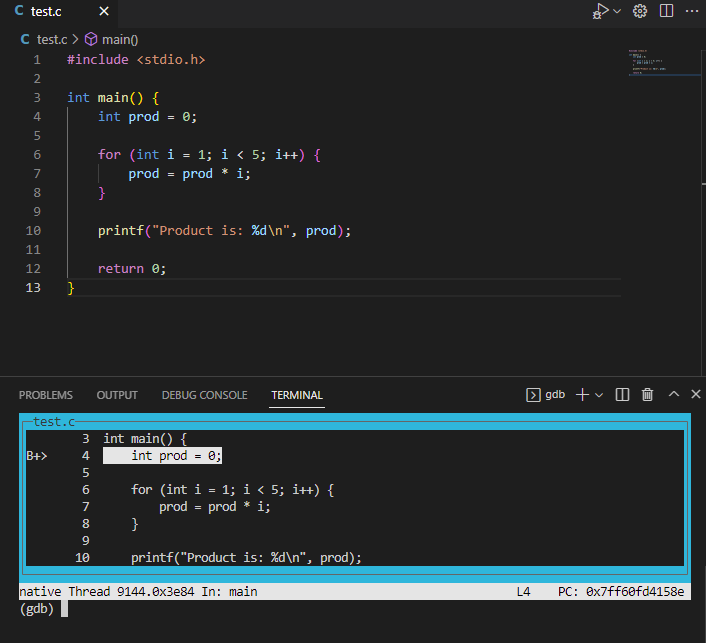
Notice that the line that will be executed next (line 4, where we declare and initialized prod) is highlighted. We can also see our main function breakpoint indicated with a B+. To step line by line through the code, we can use the next command. If we now do:
nextThen our layout view will highlight the next line in the program (the for loop), like this:
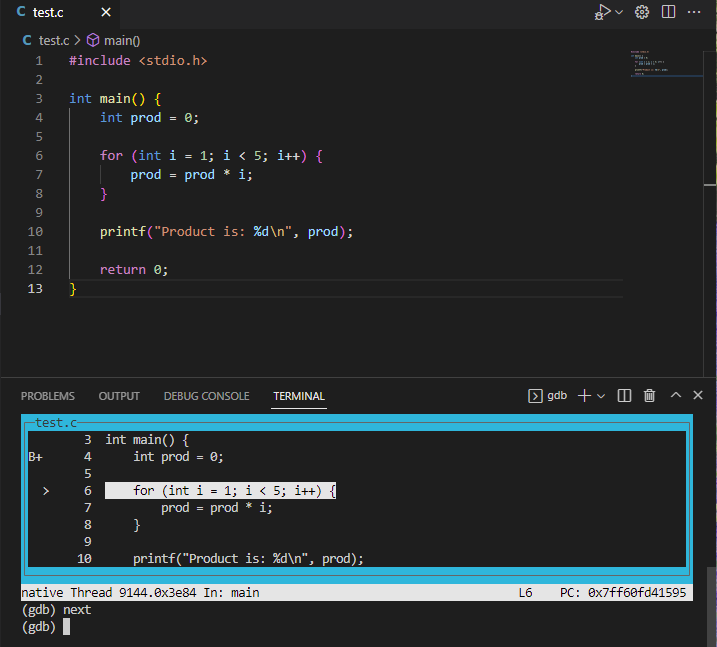
We can also examine the values of different variables. If we enter:
next
print i
We will see:
$3 = 1Which tells us that i is currently 1. If we do next again (thus executing the prod = prod * i statement) and then do:
print prodWe see:
$4 = 0Which tells us that prod is still 0, even after multiplying on the first value of i. We can likely already see the first bug – prod should have been initialized to 1 instead of 0.
We can continuing stepping though the lines of code, printing values as we go. When we step to the end of the for loop, we may realize that we never multiply prod by 5 – and we can see that this is because our for loop condition (i < 5) does not include an iteration when i is 5.
Invalid memory access
As another example, suppose we have this C program (test.c):
| |
If we build our program as usual (gcc test.c) and then run the executable (./a.exe) WITHOUT any debugging, we will likely see nothing at all. It appears as if our program mysteriously never makes it to the print statement.
On the other hand, if we build our program for debugging (gcc -g test.c -o debug) and then run it in the debugger (gdb debug), we can get more information. In gdb, we might first set a breakpoint at our print statement:
b 8And then run the program until it hits our breakpoint:
runWe will see:
Starting program: C:\...\debug.exe
[New Thread 17448.0x425c]

Thread 1 received signal SIGSEGV, Segmentation fault.
main () at test.c:6
6           int x = arr[100000];
Which tells us that our program had a segmentation fault on line 6. A segmentation fault means we are trying to access memory that does not belong to us, which is very clear in this example – our array only has 10 spots, but we’re trying to access spot 100000. Now we can see where we went wrong in our program. (This was a trivial example, but a similar approach is a great way to debug a program that is not producing any output. Most likely such a program is crashing with a segmentation fault, but without the debugger we have no way of knowing where the program crashed.)
Debugging recursive functions
As a final example, suppose we have this C program in test.c:
| |
If we build and run this program as usual, it will just hang – suggesting an infinite loop or infinite recursion. (You can kill a program in the terminal with Ctrl-C.) To find the problem, we can build our program with debugging information and run it with gdb. We might set a breakpoint at the factorial function:
b factorialAnd then:
runIt will pause on line 4 in the first call of the factorial function. We can view the program stack up to this point by typing:
btWe will see the current program stack:
#0  factorial (x=2) at test.c:4
#1  0x00007ff6956015ba in main () at test.c:8
Which shows us that the main function called the factorial function with parameter x = 2. If we do:
sTo step INTO the recursive function call, our program will pause again on line 4 in the next call to factorial. If we do:
btagain, we will see the program stack:
#0  factorial (x=1) at test.c:4
#1  0x00007ff695601599 in factorial (x=2) at test.c:4
#2  0x00007ff6956015ba in main () at test.c:8
Which shows us that our program started in main, then called factorial with parameter x=2, then called factorial again with x=1. Suppose we type s two more times, and then try bt again. We would then see:
factorial (x=-1) at test.c:4
#1  0x00007ff695601599 in factorial (x=0) at test.c:4
#2  0x00007ff695601599 in factorial (x=1) at test.c:4
#3  0x00007ff695601599 in factorial (x=2) at test.c:4
#4  0x00007ff6956015ba in main () at test.c:8
Now we can see that we made a recursive call with a parameter of -1, which is clearly incorrect. This can help us identify our error – we forgot to include a base case.
Summary of gdb commands
Here is a summary table of the most common gdb commands:
| Command | Description |
|---|---|
break lineNumber (or b lineNumber) | Sets a breakpoint at the given line number. You can add breakpoints at any point – either before running the program in the debugger or in the middle of a debugging session. |
break functionName (or b functioNname) | Sets a breakpoint at the given function name |
run (or r) | Executes your program from the beginning, and lets it run until it hits your first breakpoint |
layout src | Displays a graphical view of your code and highlights the line that will be executed next |
continue (or c) | Runs your program from its current point of execution until it hits the next breakpoint |
print variableName (or p variableName) | Prints the current value of the given variable |
print expression (or p expression) | Prints the result of the given expression using current variable values. For example, print *ptr would print the current value at the memory location held in ptr. Similarly, print arr[2]+10 would print 10 more than the element at position 2 in the arr array. |
next (or n) | Steps to the next line in the program. If the next line is a function call, it steps OVER it (and does not go into the function). |
step (or s) | Steps to the next line in the program. If the next line is a function call, it steps INTO that function. |
disable breakPoint | Disables an existing breakpoint, where breakPoint is either a line number or a function name |
enable breakPoint | Enables an existing breakpoint, where breakPoint is either a line number or a function name |
list (or l) | Prints the 10 lines of source code around the current line in the debugger |
bt | Prints the stack trace leading to the current point of execution |
kill | Kills the program being run in the debugger |
quit | Exits gdb |
Visualizing program memory
I recommend using Python Tutor with C/gcc selected as another tool for debugging. You can paste your C program into the text area and choose “Visualize Execution”. Then you can step line by line through your program. The site shows what memory is allocated on the stack and what is allocated on the heap, and shows how different variables are updated as you progress. It is especially useful for visualizing pointers. The only drawback is that it will only work on programs with no user/file input – but you could always hardcode any input values for debugging purposes.