Subsections of Getting Started
VS Code
VS Code
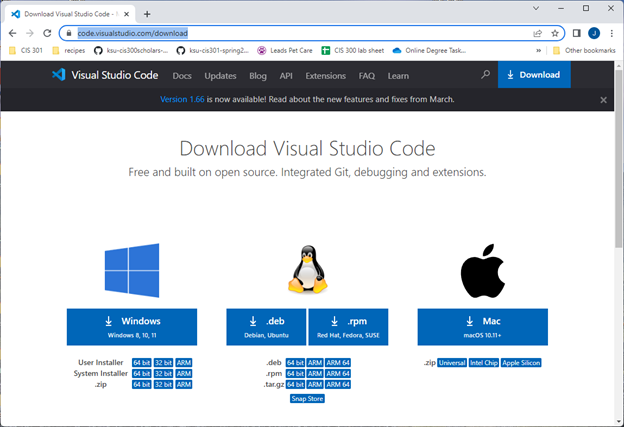
In CIS 308, we will edit our C programs using VS Code with C/C++ extensions. You likely already have Visual Studio (2019 or 2022) installed on your computer from CIS 300 and/or 400 – however, we will not be using Visual Studio in CIS 308. While it does have a C++ compiler, it behaves differently than more widely accepted C compilers (versions of gcc and clang). Finally, this class has a secondary goal of exposing students to a variety of Unix/Linux tools – something that cannot be done as easily in Visual Studio.
You can download VS Code here:
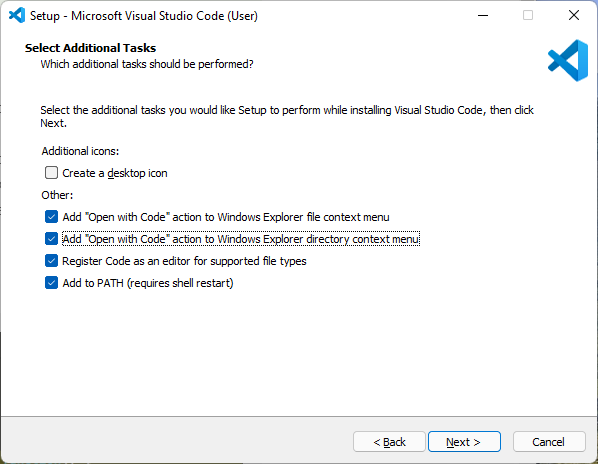
Install VS Code. When you see the prompt below, I recommend adding the “Open with code” action for both files and directories:
C/C++ extensions
If you are prompted to install C/C++, do so. If you are not, launch VS Code and select “Extensions” from the left-hand toolbar. From there, you can find and install “C/C++” (this will add syntax highlighting to our C programs).
We ONLY need C/C++, not the whole extension pack.
VS Code integrated terminal
We will be using the integrated terminal within VS Code, so that we can have the editor and the terminal (for compiling and running) within the same frame. If you do not see the Terminal at the bottom of VS code, select Terminal->New Terminal.
Windows users will want to select powershell as their terminal type, and Mac users will want to select the Mac terminal.
Get the compiler
VS code does not contain a C compiler (even with the C/C++ extensions) – we will need to install one.
Windows users
I recommend using either MSYS2 or WSL. (I prefer WSL, but on some systems it requires a BIOS edit before it will work.) You can download MSYS2 here. Follow the installation instructions.
Then, launch an MSYS2 shell (click Start, type MSYS2, and run the app). In the resulting shell, type:
pacman -S base-devel gccWhen prompted, say Y. You should now have both gcc and make installed.
In order to use these commands from the command prompt, you will need to add their location to your Path. Check both C:\msys64\mingw64\bin and C:\msys64\usr\bin – copy the address of whichever location contains gcc.exe.
Next, add that location to your Path. Click Start, type Environment variables, and select “Edit the system environment variables”). Click “Environment Variables..”, then find Path under System variables and click “Edit…”. Click “New”, paste in the address you copied in the previous step, and click OK three times to dismiss each frame.
Open VS Code with an integrated terminal. Try typing:
gccand then:
makeYou should see an error that no input files were provided (and not that the term is unrecognized).
Mac users
After installing VS Code with C/C++, follow this user guide to get gcc and make.
Open VS Code with an integrated terminal, and type:
gcc --versionIf you get an error that gcc is unrecognized, run the command:
xcode-select --installIf you try gcc --version again, it should give you a version number.
Organizing labs
I recommend that you create a folder specifically for CIS 308, and then create subfolders within that folder for each lab assignment. If you are using the lab machines, you will want to put this folder on the U: drive, as files saved in other locations may be deleted.
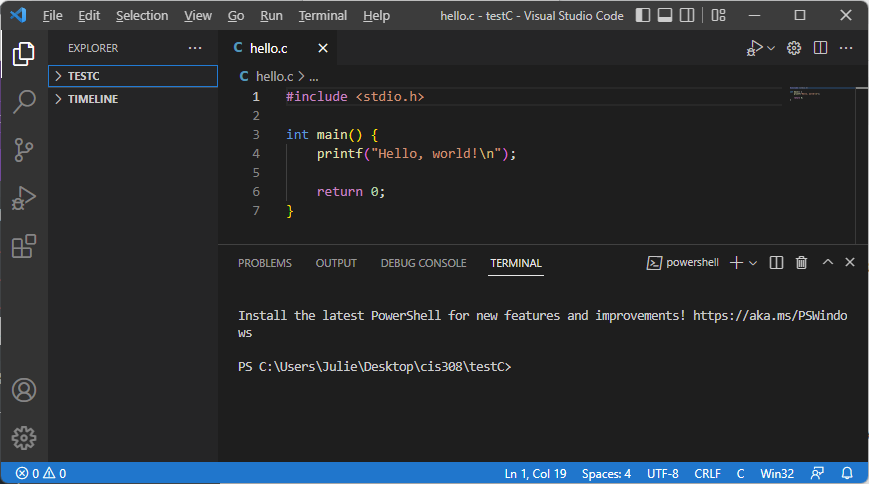
When you are ready to start a lab assignment, right-click your CIS 308 folder and select “Open with Code”:
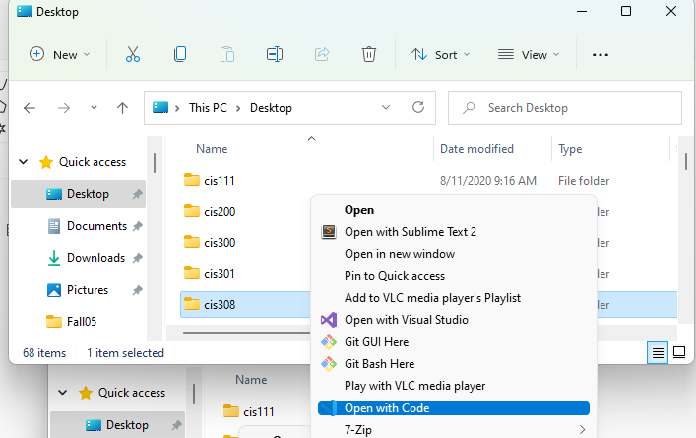
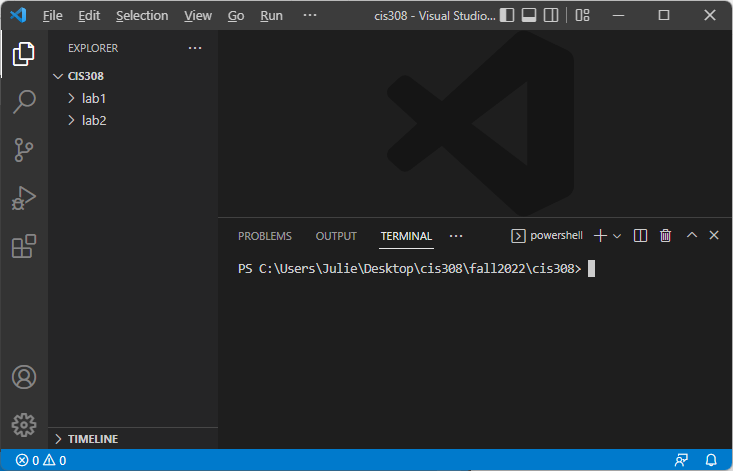
This will open everything within your CIS 308 subfolder in VS Code:
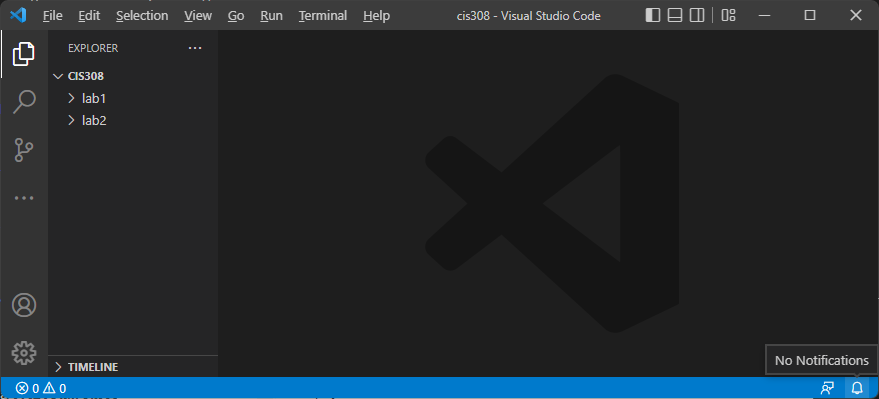
Now, display the integrated terminal in VS Code (Terminal->New Terminal):
(My directory structure might look strange because I created a second CIS 308 folder for the purposes of making these screenshots.)
Starting the next lab
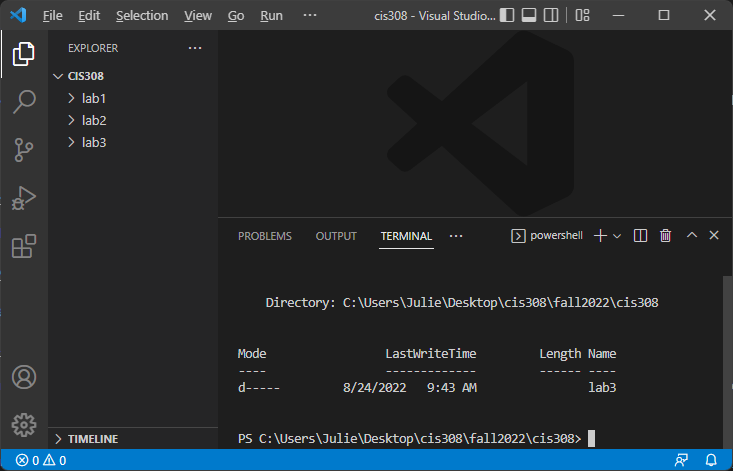
After following the instructions above to open VS Code to your CIS 308 folder with the integrated terminal displayed, you are ready to create a new, empty folder for the current lab. Suppose we are ready for lab 3. In the integrated terminal, type:
mkdir lab3You should see a new lab3 folder in the project view on the left:
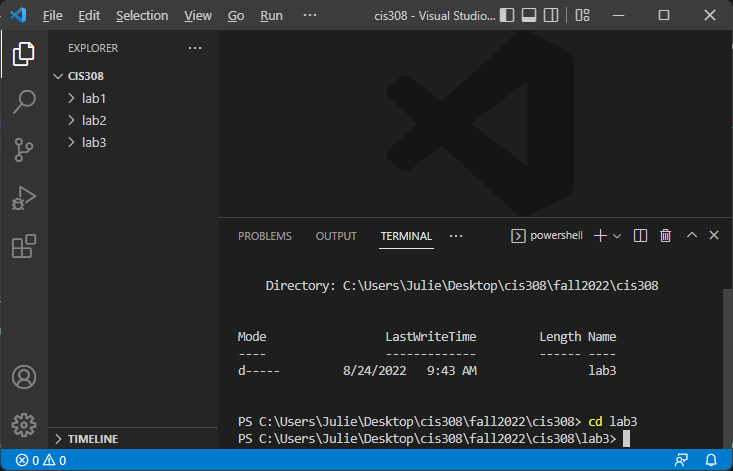
Next, use the cd command in the integrated terminal to change directories to your new folder. Type:
cd lab3(or whatever the current lab is). You should notice that the directory listed in the terminal prompt ends with you new folder, like this:
You are now ready to follow the steps in the next section, “Using Git”, to clone the starting repository for your lab.
Using git
This class will use GitHub links to create initial repositories for both labs and programming projects, similarly to what you have done in CIS 300 and 301.
GitHub account
First, you will need to create a GitHub account here. If you already have one, you can use your existing account.
Verify a git install
You will likely already have a command-line version of git installed on your machine. To check, open a folder in VS Code, display the integrated terminal, and type:
git --versionYou should see a version number printing out. If you see that, git is already installed.
If you see an error that git is unrecognized, then you will need to install it. Go here to download and install the latest version.
Windows users may need to add the git.exe location to the system Path environment variables. Most likely, git.exe will be installed to C:\Program Files\Git\bin. Check this location, copy its address, and type “Environment variables” in the Windows search. Click “Environment Variables” and find “Path” under System variables. Click “Edit…”. Verify that C:\Program Files\Git\bin (or whatever your git location) is the last item listed. If it isn’t, add a new entry for C:\Program Files\Git\bin.
Clone the repository
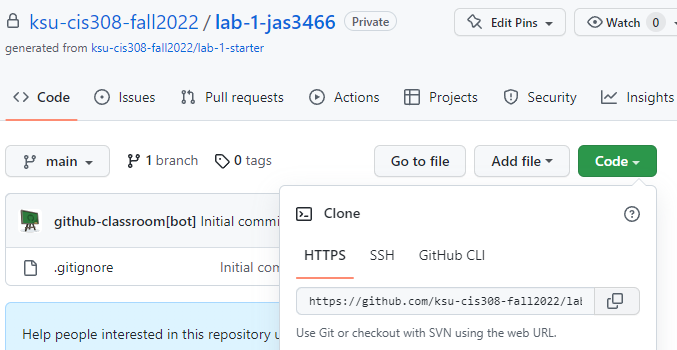
When you get a new assignment, first click the assignment link – this will create an initial GitHub repository.
After opening your GitHub repository, click the green “Code” button and click the copy icon next to the URL name. This will copy the URL of your GitHub repository:
For labs, follow the instructions under “Organizing Labs” in section 0.1 to open your CIS 308 folder in VS Code, create a new lab folder, and change directories to your empty folder.
For projects, create an empty folder on your machine, right-click the folder name, and select “Open with Code”. Then open the Terminal within VS Code by selecting “Terminal->New Terminal”. The terminal should automatically display the empty folder you just created.
Clone your GitHub repository to your new, empty folder by typing in the terminal:
git clone {repository-url} ./Where {repository-url} is the URL you copied from your GitHub repository (leave off the { and } when you insert your URL). The ./ tells git to clone the repository to the current directory.
Add code and test
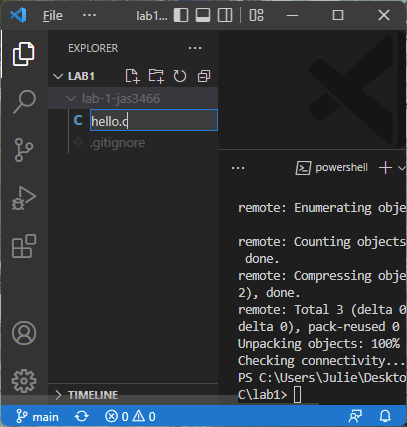
Add the necessary programming files to your project. You can add a file in VS Code by clicking your project name under “Explorer”, and then clicking the icon labeled “New File” (it looks a piece of paper with a plus sign). Type the name of your new file and hit Enter to save it:
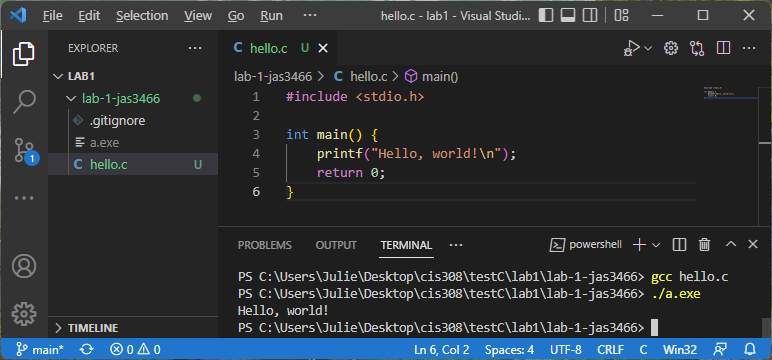
Write the code for your project. As you go, save it and test it with the gcc compiler. If it builds, run the resulting executable (either a.exe or a.out). Here is an example of compiling and running a Hello, World! program:
Commit and push
Once you are ready to commit your changes, type the following in the integrated terminal:
git add .This will add all changes to the current commit. Then type:
git commit -m "descriptive message"to create a local commit, where “descriptive message” is replaced with a message describing your changes (you DO need to include the quotations). Finally, push your local commit to the current branch:
git pushIf you go to your GitHub repository URL, you should see the latest changes.
Compiling and Running
After you have installed VS Code along with gcc, you can write C programs in the VS Code editor and then use the integrated terminal to compile and run.
Hello, World! in VS Code
Here is a Hello, World! program written in C using VS Code. It is saved to the file hello.c (note that .c is the extension for C programs):
Find code in terminal
To compile and run a C program, make sure the integrated terminal appears below the code in VS Code (as shown above). If it doesn’t, select “Terminal->New Terminal”. This will open a new terminal in your current directory.
List directory contents
In the integrated terminal, type:
lsThis should list the contents of the current directory, which hopefully includes your hello.c file. If you get an error that ls is unrecognized (which it might be, depending on what kind of terminal you are using), try:
dirinstead.
Change directory
If you do not see your code file displayed after typing ls or dir, then you are likely not in the folder that contains your code. If your code is contained within a subfolder of the current directory path displayed in the terminal, do:
cd {dir-name}where dir-name is the name of a subfolder within the terminal’s current directory. (Make sure to leave off the { and } when substiting a directory name.) This will change the terminal’s current directory to be: dir-name.
Alternatively, you may need to back out to the parent folder of the current directory. If you do:
cd ..Then the terminal’s current directory will update to be its parent folder.
Compile and run
Once you have found the directory with your code (which was most likely the original terminal directory without having to make any changes), you are ready to compile your code. To compile our hello.c program, we type:
gcc hello.c(replacing hello.c with the name of our C program file). If there were no errors, it will generate an executable file. If you type:
ls(or dir), you should see either a.out or a.exe – this is the executable file for your program.
To run your executable, type either:
./a.outor:
./a.exeDepending on the name of your executable file. You should see your program running in the terminal.
Here is an example of compiling and running our Hello, World! program in the VS Code terminal:
Terminal commands
A side goal of this class is for students to become more comfortable with using the terminal. With practice, you will find that you are faster at navigating folders, creating files/folders, compiling/running programs, using tools stuch as git, etc. using the terminal than you are using a GUI. Familiarity with a terminal is especially useful in system administration and web development.
Summary of common terminal commands
Here is a summary table of the most common terminal commands for this course:
| Command | Description |
|---|---|
| dir | Lists the current directory contents (only available in Windows) |
| ls | Lists the current directory contents (not available in Windows command prompt) |
| cd dirName | Changes the current directory in the terminal to be dirName. (Note: dirName must be a subfolder of the current directory.) |
| mkdir dirName | Makes a new, empty directory called dirName |
| ni fileName | Creates a new, empty file called fileName. We can do ni prog.c to create a new C program called prog.c (only available in Windows) |
| touch fileName | Creates a new, empty file called fileName. We can do touch prog.c to create a new C program called prog.c (only available in Mac/Linux/Unix) |
| cd .. | Updates the current directory in the terminal to be its parent directory. For example, if the current directory is C:\Users\Julie, then cd .. makes the current directory be C:\Users |
| del fileName | Deletes the file called fileName, which must be in the current directory (only available in Windows) |
| rm fileName | Deletes the file called fileName, which must be in the current directory (only available in Mac/Linux/Unix) |
Other terminal tips
When you are typing a directory name or file name in the terminal, you can type a few letters and hit Tab – the terminal will attempt to autocomplete the rest of the name.
To recall a command you recently typed in the terminal, you can use the up or down arrows. This saves you from typing the same commands over and over.
Debugging C programs
gdb is the C debugger. It allows you to create an executable specifically for debugging purposes.
Getting gdb
First, ensure that you have gdb installed.
gdb on Windows
Type in a terminal:
gdb --versionIf you see a version number, then you already have gdb installed. If you see an error that gdb is unrecognized, you will need to install it. Launch a MSYS2 prompt (Windows icon->type MSYS2) and then type the following in MSYS2:
pacman -S mingw-w64-x86_64-gdbThis should install gdb. Next, you will need to add the gdb.exe location to your Path. It may be in the same location as gcc, which for me is C:\msys64\mingw64\bin, but it may be in a different location. The gdb.exe file should be in a \bin folder somewhere within the C:\msys64 folder - you may need to search for it. Copy the address where you find the gdb.exe file.
Next, add the location of your gdb.exe file to your Path (if it is a different location than your gcc.exe file). Click Start, type Environment variables, and select “Edit the system environment variables”). Click “Environment Variables..”, then find Path under System variables and click “Edit…”. Look to see if the location of your gdb.exe file is already listed – if it is, you don’t need to add anything. If it’s not, click “New”, paste in the address you copied in the previous step, and click OK three times to dismiss each frame.
gdb on Mac
I recommend following this tutorial to get gdb on your machine.
First tutorial
Suppose we have the following program, test.c. This program is supposed to multiply together the numbers 1 * 2 * 3 * 4 * 5, but it has some problems:
| |
First, build an executable with debugging information:
gcc -g test.c -o debugThis will create the executable debug. You can run gdb on debug as follows (this will launch gdb, but will not yet start running your program):
gdb debugYou will see something like:
GNU gdb (GDB) 12.1
Copyright (C) 2022 Free Software Foundation, Inc.
License GPLv3+: GNU GPL version 3 or later <http://gnu.org/licenses/gpl.html>
This is free software: you are free to change and redistribute it.
There is NO WARRANTY, to the extent permitted by law.
Type "show copying" and "show warranty" for details.
This GDB was configured as "x86_64-w64-mingw32".
Type "show configuration" for configuration details.
For bug reporting instructions, please see:
<https://www.gnu.org/software/gdb/bugs/>.
Find the GDB manual and other documentation resources online at:
    <http://www.gnu.org/software/gdb/documentation/>.

For help, type "help".
Type "apropos word" to search for commands related to "word"...
Reading symbols from debug...
(gdb)
That last (gdb) at the end is the debugging prompt.
Before you execute your program in the debugger, you’ll want to set a breakpoint (or several). For example, suppose we want to set a breakpoint at the start of the main function. Then we can type:
break main(We could have also typed break 3, which sets a breakpoint on line 3 – which is the beginning of the main function.) You can add more than one breakpoint in this way.
When we have added our breakpoint(s) and are ready to run our program with debugging, we type at the debugging prompt:
run(If our program accepts command-line arguments, we include them after the run command.) We see:
Starting program: C:\...\debug.exe
[New Thread 9144.0x47d8]

Thread 1 hit Breakpoint 1, main () at test.c:4
4           int prod = 0;
Which tells us that our program has stopped at our breakpoint just before executing line 4 (which is the first statement that performs an operation in our main function). From here, we can graphically view the current line in the program by typing:
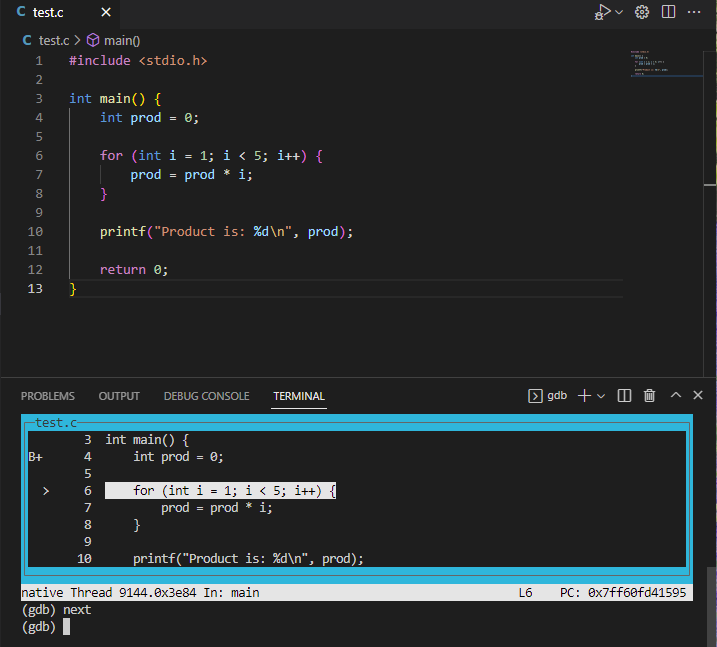
layout srcIn this example, we will see:
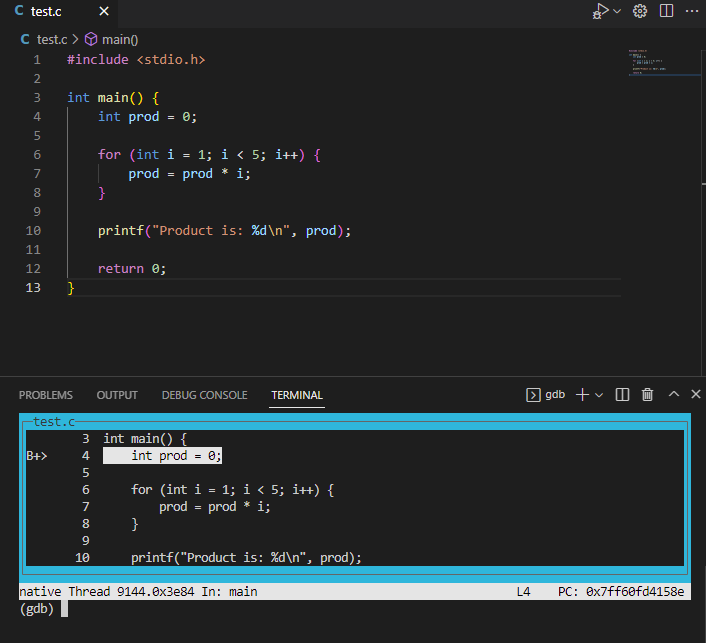
Notice that the line that will be executed next (line 4, where we declare and initialized prod) is highlighted. We can also see our main function breakpoint indicated with a B+. To step line by line through the code, we can use the next command. If we now do:
nextThen our layout view will highlight the next line in the program (the for loop), like this:
We can also examine the values of different variables. If we enter:
next
print i
We will see:
$3 = 1Which tells us that i is currently 1. If we do next again (thus executing the prod = prod * i statement) and then do:
print prodWe see:
$4 = 0Which tells us that prod is still 0, even after multiplying on the first value of i. We can likely already see the first bug – prod should have been initialized to 1 instead of 0.
We can continuing stepping though the lines of code, printing values as we go. When we step to the end of the for loop, we may realize that we never multiply prod by 5 – and we can see that this is because our for loop condition (i < 5) does not include an iteration when i is 5.
Invalid memory access
As another example, suppose we have this C program (test.c):
| |
If we build our program as usual (gcc test.c) and then run the executable (./a.exe) WITHOUT any debugging, we will likely see nothing at all. It appears as if our program mysteriously never makes it to the print statement.
On the other hand, if we build our program for debugging (gcc -g test.c -o debug) and then run it in the debugger (gdb debug), we can get more information. In gdb, we might first set a breakpoint at our print statement:
b 8And then run the program until it hits our breakpoint:
runWe will see:
Starting program: C:\...\debug.exe
[New Thread 17448.0x425c]

Thread 1 received signal SIGSEGV, Segmentation fault.
main () at test.c:6
6           int x = arr[100000];
Which tells us that our program had a segmentation fault on line 6. A segmentation fault means we are trying to access memory that does not belong to us, which is very clear in this example – our array only has 10 spots, but we’re trying to access spot 100000. Now we can see where we went wrong in our program. (This was a trivial example, but a similar approach is a great way to debug a program that is not producing any output. Most likely such a program is crashing with a segmentation fault, but without the debugger we have no way of knowing where the program crashed.)
Debugging recursive functions
As a final example, suppose we have this C program in test.c:
| |
If we build and run this program as usual, it will just hang – suggesting an infinite loop or infinite recursion. (You can kill a program in the terminal with Ctrl-C.) To find the problem, we can build our program with debugging information and run it with gdb. We might set a breakpoint at the factorial function:
b factorialAnd then:
runIt will pause on line 4 in the first call of the factorial function. We can view the program stack up to this point by typing:
btWe will see the current program stack:
#0  factorial (x=2) at test.c:4
#1  0x00007ff6956015ba in main () at test.c:8
Which shows us that the main function called the factorial function with parameter x = 2. If we do:
sTo step INTO the recursive function call, our program will pause again on line 4 in the next call to factorial. If we do:
btagain, we will see the program stack:
#0  factorial (x=1) at test.c:4
#1  0x00007ff695601599 in factorial (x=2) at test.c:4
#2  0x00007ff6956015ba in main () at test.c:8
Which shows us that our program started in main, then called factorial with parameter x=2, then called factorial again with x=1. Suppose we type s two more times, and then try bt again. We would then see:
factorial (x=-1) at test.c:4
#1  0x00007ff695601599 in factorial (x=0) at test.c:4
#2  0x00007ff695601599 in factorial (x=1) at test.c:4
#3  0x00007ff695601599 in factorial (x=2) at test.c:4
#4  0x00007ff6956015ba in main () at test.c:8
Now we can see that we made a recursive call with a parameter of -1, which is clearly incorrect. This can help us identify our error – we forgot to include a base case.
Summary of gdb commands
Here is a summary table of the most common gdb commands:
| Command | Description |
|---|---|
break lineNumber (or b lineNumber) | Sets a breakpoint at the given line number. You can add breakpoints at any point – either before running the program in the debugger or in the middle of a debugging session. |
break functionName (or b functioNname) | Sets a breakpoint at the given function name |
run (or r) | Executes your program from the beginning, and lets it run until it hits your first breakpoint |
layout src | Displays a graphical view of your code and highlights the line that will be executed next |
continue (or c) | Runs your program from its current point of execution until it hits the next breakpoint |
print variableName (or p variableName) | Prints the current value of the given variable |
print expression (or p expression) | Prints the result of the given expression using current variable values. For example, print *ptr would print the current value at the memory location held in ptr. Similarly, print arr[2]+10 would print 10 more than the element at position 2 in the arr array. |
next (or n) | Steps to the next line in the program. If the next line is a function call, it steps OVER it (and does not go into the function). |
step (or s) | Steps to the next line in the program. If the next line is a function call, it steps INTO that function. |
disable breakPoint | Disables an existing breakpoint, where breakPoint is either a line number or a function name |
enable breakPoint | Enables an existing breakpoint, where breakPoint is either a line number or a function name |
list (or l) | Prints the 10 lines of source code around the current line in the debugger |
bt | Prints the stack trace leading to the current point of execution |
kill | Kills the program being run in the debugger |
quit | Exits gdb |
Visualizing program memory
I recommend using Python Tutor with C/gcc selected as another tool for debugging. You can paste your C program into the text area and choose “Visualize Execution”. Then you can step line by line through your program. The site shows what memory is allocated on the stack and what is allocated on the heap, and shows how different variables are updated as you progress. It is especially useful for visualizing pointers. The only drawback is that it will only work on programs with no user/file input – but you could always hardcode any input values for debugging purposes.
Remote Access
In the case that you are unable (or uninterested) to install some of the C tools on your own machine (such as gcc, gdb, or make), you can install the Remote - SSH extension in VS Code. This will allow you to remotely connect to the CS Linux server, which already has all the C tools installed. You will be able to use VS Code to edit files that are stored on your CS department U: drive the same way that you would edit local files.
Getting the Remote - SSH extension
In VS Code, find the extensions icon on the left hand side (it looks like four squares with one corner pulled away). Search for remote and find Remote - SSH (the current version is v0.90.1, but install the latest version if you see a newer version number). Click Install.
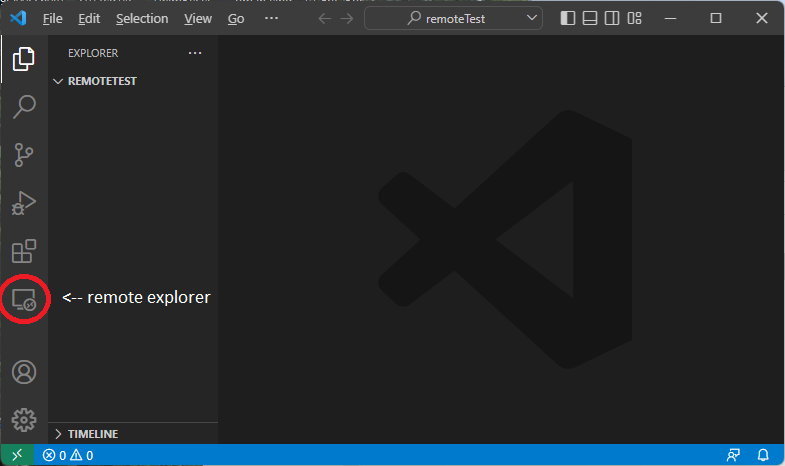
You should now see the remote explorer icon on the left bar in VS code, like this:
K-State VPN
If you are off-campus, you will need to connect to the VPN used by K-State (GlobalProtect) before you can make a remote connection. If you already have GlobalProtect installed, connect to it. If you don’t, go here for installation links.
If you are on-campus (and on a K-State network connection), you do not need to connect to a VPN.
Connecting to CS Linux
To connect to CS Linux, click the remote explorer icon here:
If this is your first time making a remote connection, you will see this page:
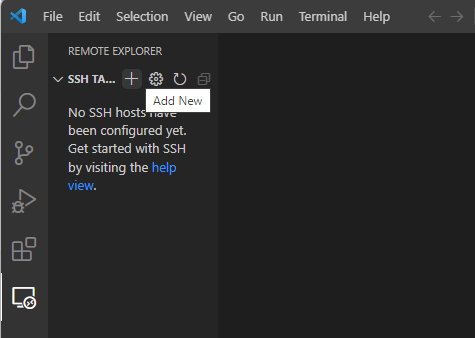
When you hover over SSH Targets, you should see a plus (+) icon that says “Add New” (as shown above). Click it. You will see a prompt that says: *Enter SSH Connection Command". Type:
ssh eID@cslinux.cs.ksu.eduwhere eID is your eID. Press Enter to connect.
It may ask you to set up an SSH client, if one isn’t already installed. If so, go here for SSH client installation information.
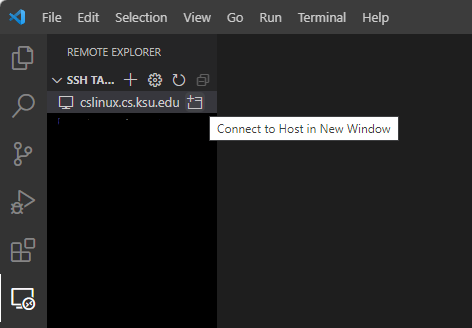
If an SSH client is already installed, it will ask you to select an SSh configuration file. Select one from the menu. At this point, you should see cslinux.cs.ksu.edu under SSH Targets. Hover over the cslinux.cs.ksu.edu name and select Connect to Host in New Window:
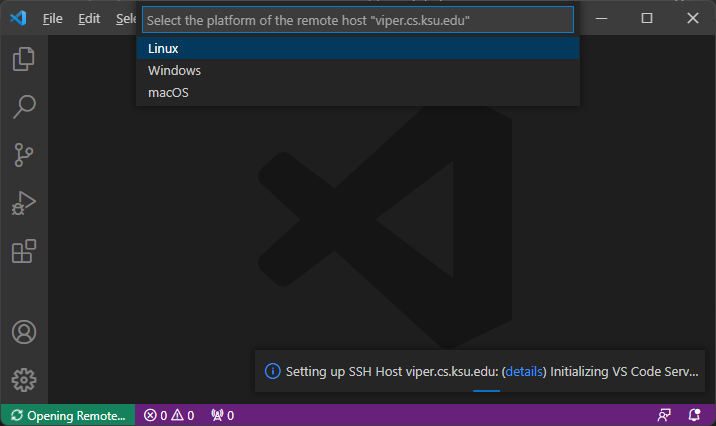
Select “Linux” as the platform:
Click Continue when prompted, and then enter your CS password (NOT your eID password) to login. You should see:
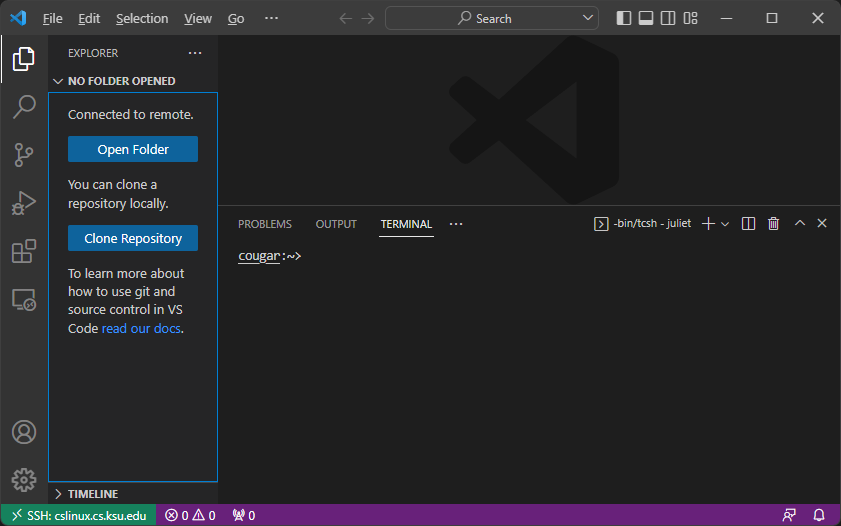
Click Open Folder, and navigate to a folder on your department U: drive. If you are prompted to log in again, do so. You should see the folder on the left side and a Linux terminal in the same directory on the bottom. You can also open files in that directory the same way you might with local files. For example, I might see:
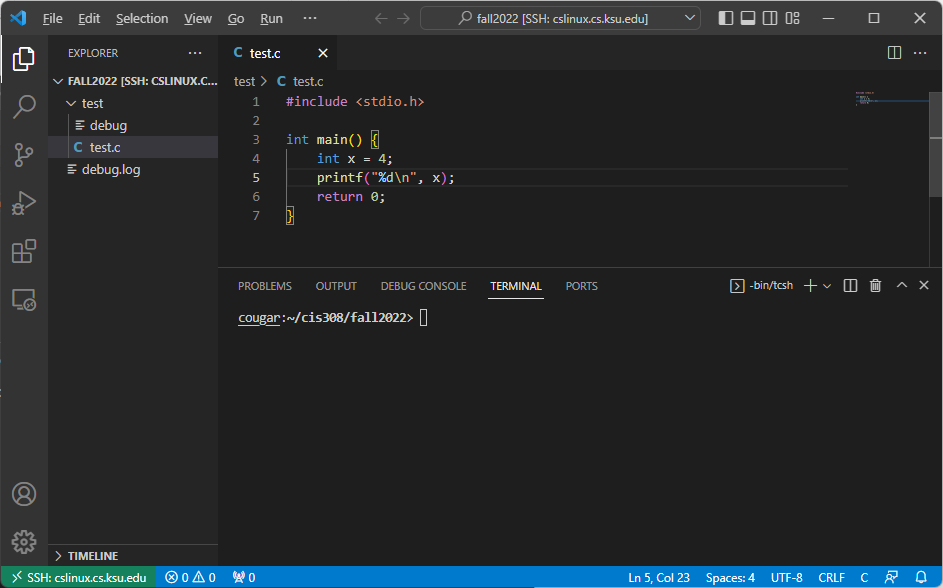
From there, you can use gcc, gdb, or make to compile, debug, or build your projects.
Once you are done with your connection, close the connection by going to File->Close Remote Connection (you might need to scroll down in the menu).
The next time you click *Remote Explorer" to connect to CS Linux, you should see cslinux.cs.ksu.edu already listed under SSH targets.