Debugging & Logging
Debugging with the Debug Utility
Now that we have a basic Express application, let’s add some helpful tools for developers to make our application easier to work with and debug in the future. These are some great quality of life tweaks that many professional web applications include, but often new developers fail to add them early on in development and waste lots of time adding them later. So, let’s take some time now to add these features before we start developing any actual RESTful endpoints.
First, you may have noticed that the bin/www file includes the debug utility. This is a very common debugging module that is included in many Node.sj applications, and is modeled after how Node.js itself handles debugging internally. It is a very powerful module, and one that you should make use of anytime you are creating a Node.js library to be published on npm and shared with others.
Let’s quickly look at how we can use the debug utility in our application. Right now, when we start our application, we see very little output on the terminal:
$ npm startThat command produces this output:
> example-project@0.0.1 start
> node ./bin/www
As we access various pages and routes, we may see some additional lines of output appear, like this:
GET / 304 2.569 ms - -
GET /users 200 2.417 ms - 23
GET / 200 1.739 ms - 120
These lines come from the morgan request logging middleware, which we’ll discuss on the next page of this example.
To enable the debug library, we simply must set an environment variable in the terminal when we run our application, as shown here:
$ DEBUG=* npm startEnvironment Variables
An environment variable is a value that is present in memory in a running instance of an operating system. These generally give running processes information about the system, but may also include data and information provided by the user or system administrator. Environment variables are very common ways to configure applications that run in containers, like our application will when it is finally deployed. We’ll cover this in detail later in this course; for now, just understand that we are setting a variable in memory that can be accessed inside of our application.
Now, we’ll be provided with a lot of debugging output from all throughout our application:
> example-project@0.0.1 start
> node ./bin/www

  express:router:route new '/' +0ms
  express:router:layer new '/' +1ms
  express:router:route get '/' +0ms
  express:router:layer new '/' +1ms
  express:router:route new '/' +0ms
  express:router:layer new '/' +0ms
  express:router:route get '/' +0ms
  express:router:layer new '/' +0ms
  express:application set "x-powered-by" to true +1ms
  express:application set "etag" to 'weak' +0ms
  express:application set "etag fn" to [Function: generateETag] +0ms
  express:application set "env" to 'development' +0ms
  express:application set "query parser" to 'extended' +0ms
  express:application set "query parser fn" to [Function: parseExtendedQueryString] +0ms
  express:application set "subdomain offset" to 2 +0ms
  express:application set "trust proxy" to false +0ms
  express:application set "trust proxy fn" to [Function: trustNone] +1ms
  express:application booting in development mode +0ms
  express:application set "view" to [Function: View] +0ms
  express:application set "views" to '/workspaces/example-project/server/views' +0ms
  express:application set "jsonp callback name" to 'callback' +0ms
  express:router use '/' query +1ms
  express:router:layer new '/' +0ms
  express:router use '/' expressInit +0ms
  express:router:layer new '/' +0ms
  express:router use '/' logger +0ms
  express:router:layer new '/' +0ms
  express:router use '/' jsonParser +0ms
  express:router:layer new '/' +0ms
  express:router use '/' urlencodedParser +1ms
  express:router:layer new '/' +0ms
  express:router use '/' cookieParser +0ms
  express:router:layer new '/' +0ms
  express:router use '/' serveStatic +0ms
  express:router:layer new '/' +0ms
  express:router use '/' router +0ms
  express:router:layer new '/' +1ms
  express:router use '/users' router +0ms
  express:router:layer new '/users' +0ms
  express:application set "port" to 3000 +2ms
  server:server Listening on port 3000 +0ms
Each line of output starts with a package name, such as express:application showing the namespace where the logging message came from (which usually corresponds to the library or module it is contained in), followed by the message itself. The last part of the line looks like +0ms, and is simply a timestamp showing the time elapsed since the last debug message was printed.
At the very bottom we see the debug line server:server Listening on port 3000 +0ms - this line is what is actually printed in the bin/www file. Let’s look at that file and see where that comes from:
// -=-=- other code omitted here -=-=-

import debugLibrary from 'debug';
const debug = debugLibrary('server:server');

// -=-=- other code omitted here -=-=-

function onListening() {
  var addr = server.address();
  var bind = typeof addr === 'string'
    ? 'pipe ' + addr
    : 'port ' + addr.port;
  debug('Listening on ' + bind);
}
At the top of that file, we import the debug library, and then instantiate it using the name 'server:server'. This becomes the namespace for our debug messages printed using this instance of the debug library. Then, inside of the onListening() function, we call the debug function and provide a message to be printed.
When we run our application, we can change the value of the DEBUG environment variable to match a particular namespace to only see messages from that part of our application:
$ $ DEBUG=server:* npm startThis will only show output from our server namespace:
> example-project@0.0.1 start
> node ./bin/www

  server:server Listening on port 3000 +0ms
The debug utility is a very powerful tool for diagnosing issues with a Node.js and Express application. You can learn more about how to use and configure the debug utility in the documentation.
Logging with Winston
However, since we are focused on creating a web application and not a library, let’s replace debug with the more powerful winston logger. This allows us to create a robust logging system based on the traditional concept of severity levels of the logs we want to see.
To start, let’s install winston using the npm command (as always, we should make sure we are working in the server directory of our application):
$ npm install winstonWe should see output similar to the following:
added 28 packages, and audited 118 packages in 2s

15 packages are looking for funding
  run `npm fund` for details

found 0 vulnerabilities
Multiple Dependencies
Notice how installing a single dependency actually installed 28 individual packages? This is a very useful feature of how Node.js and npm packages are structured, since each package can focus on doing only one task really well while reusing common tools and utilities that other packages may also use (thereby reducing the number of duplicated packages that may need to be installed). Unfortunately, this can also lead to situations where an issue with a single package can cause cascading failures and incompatibilities across the board. So, while it is very helpful to install these dependencies in our application, we always want to do so with caution and make sure are always using dependencies that are well maintained and actually add value to our application.
The left-pad Incident
For a vivid case study of the concerns around using unnecessary dependencies, look at the npm left-pad incident. The left-pad library was a simple utility that added padding to the left side of a string. The entire library itself was a single function that contained less than 10 lines of actual code. However, when the developer of that library removed access to it due to a dispute, it ended up nearly breaking the entire npm ecosystem. Core development tools such as Babel, Webpack and more all used that library as a dependency, and with the rise of automated build systems, each tool broke as soon as the next rebuild cycle was initiated. It also caused issues with major online platforms such as Facebook, PayPal, Netflix, and Spotify.
Even today, nearly 9 years after the incident, the left-pad library is still present on npm, even though it is listed as deprecated since JavaScript now includes a method String.prototype.padStart() that performs the same action. As of January 2025, there are still 540 libraries on npm that list left-pad as a dependency, and it is downloaded over 1 million times per week!
Now that we’ve installed winston, we should configure it. We could place all of the code to configure it inside of each file where it is used, but let’s instead create a standalone configuration file for winston that we can use throughout our application.
To do this, let’s create a new folder named configs inside of our server folder to house configurations for various dependencies, and then inside of that folder create a new file named logger.js for this configuration. In that file, we can place the following content:
import winston from 'winston';
const { combine, timestamp, printf, colorize, align, errors } = winston.format;

// Log Levels
//   error: 0
//   warn: 1
//   info: 2
//   http: 3
//   verbose: 4
//   debug: 5
//   silly: 6

function level () {
    if (process.env.LOG_LEVEL) {
      if (process.env.LOG_LEVEL === '0' || process.env.LOG_LEVEL === 'error') {
        return 'error';
      }
      if (process.env.LOG_LEVEL === '1' || process.env.LOG_LEVEL === 'warn') {
        return 'warn';
      }
      if (process.env.LOG_LEVEL === '2' || process.env.LOG_LEVEL === 'info') {
        return 'info';
      }
      if (process.env.LOG_LEVEL === '3' || process.env.LOG_LEVEL === 'http') {
        return 'http';
      }
      if (process.env.LOG_LEVEL === '4' || process.env.LOG_LEVEL === 'verbose') {
        return 'verbose';
      }
      if (process.env.LOG_LEVEL === '5' || process.env.LOG_LEVEL === 'debug') {
        return 'debug';
      }
      if (process.env.LOG_LEVEL === '6' || process.env.LOG_LEVEL === 'silly') {
        return 'silly';
      }
    }
    return 'http';
}

const logger = winston.createLogger({
    // call `level` function to get default log level
    level: level(),
    // Format configuration
    format: combine(
        colorize({ all: true }),
        errors({ stack: true}),
        timestamp({
            format: 'YYYY-MM-DD hh:mm:ss.SSS A',
        }),
        align(),
        printf((info) => `[${info.timestamp}] ${info.level}: ${info.stack ? info.message + "\n" + info.stack : info.message}`)
    ),
    // Output configuration
    transports: [new winston.transports.Console()]
})

export default logger;
At the top, we see a helpful comment just reminding us which log levels are available by default in winston. Then, we have a level function that determines what our desired log level should be based on an environment variable named LOG_LEVEL. We’ll set that variable a bit later in this tutorial. Based on that log level, our system will print any logs at that level or lower in severity level. Finally, we create an instance of the winston logger and provide lots of configuration information about our desired output format. All of this is highly configurable. To fully understand this configuration, take some time to review the winston documentation.
Now, let’s update our bin/www file to use this logger instead of the debug utility. Lines that have been changed are highlighted:
// -=-=- other code omitted here -=-=-

// var debug = require('debug')('server:server');
// import debugLibrary from 'debug';
// const debug = debugLibrary('server:server');
import logger from '../configs/logger.js';

// -=-=- other code omitted here -=-=-

function onError(error) {
  if (error.syscall !== 'listen') {
    throw error;
  }

  var bind = typeof port === 'string'
    ? 'Pipe ' + port
    : 'Port ' + port;

  // handle specific listen errors with friendly messages
  switch (error.code) {
    case 'EACCES':
      // console.error(bind + ' requires elevated privileges');
      logger.error(new Error(bind + ' requires elevated privileges'));
      process.exit(1);
      break;
    case 'EADDRINUSE':
      // console.error(bind + ' is already in use');
      logger.error(new Error(bind + ' is already in use'));
      process.exit(1);
      break;
    default:
      throw error;
  }
}

/**
 * Event listener for HTTP server "listening" event.
 */

function onListening() {
  var addr = server.address();
  var bind = typeof addr === 'string'
    ? 'pipe ' + addr
    : 'port ' + addr.port;
  // debug('Listening on ' + bind);
  logger.debug('Listening on ' + bind)
}
Basically, we’ve replaced all instances of the debug method with logger.debug. We’ve also replaced a couple of uses of console.error to instead use logger.error. They will also create new Error object, which will cause winston to print a stack trace as well.
With that change in place, we can now remove the debug utility from our list of dependencies:
$ npm uninstall debugNow, let’s run our program to see winston in action:
$ npm startWhen we run it, we should see this output:
> example-project@0.0.1 start
> node ./bin/www
Notice how winston didn’t print any debug messages? That is because we haven’t set our LOG_LEVEL environment variable. So, let’s do that by creating two different scripts in our package.json file - one to run the application with a default log level, and another to run it with the debug log level:
{
  "name": "example-project",
  "version": "0.0.1",
  "type": "module",
  "private": true,
  "scripts": {
    "start": "LOG_LEVEL=http node ./bin/www",
    "dev": "LOG_LEVEL=debug node ./bin/www"
  },
  "dependencies": {
    "cookie-parser": "~1.4.7",
    "express": "~4.21.2",
    "morgan": "~1.10.0",
    "winston": "^3.17.0"
  }
}
The npm run command can be used to run any of the scripts in the scripts section of our package.json file.
So, if we want to run our application so we can see the debug messages, we can use the following command:
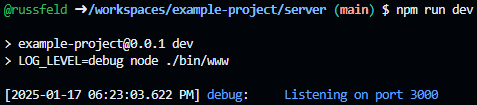
$ npm run devNow we should see some debug messages in the output:
> example-project@0.0.1 dev
> LOG_LEVEL=debug node ./bin/www

[2025-01-17 06:23:03.622 PM] info:      Listening on port 3000
Great! Notice how the logger outputs a timestamp, the log level, and the message, all on the same line? This matches the configuration we used in the configs/logger.js file. On most terminals, each log level will even be a different color!
Finally, since we really should make sure the message that the application is successfully listening on a port is printed by default, let’s change it to the info log level in our bin/www file:
// -=-=- other code omitted here -=-=-

function onListening() {
  var addr = server.address();
  var bind = typeof addr === 'string'
    ? 'pipe ' + addr
    : 'port ' + addr.port;
  // debug('Listening on ' + bind);
  logger.info('Listening on ' + bind)
}
Why Not Use NODE_ENV?
In many web applications written using Node.js and Express, you may have come across the NODE_ENV environment variable, which is often set to either development, production, or sometimes test to configure the application. While this may have made sense in the past, it is now considered an anti-pattern in Node.js. This is because there no fundamental difference between development and production in Node.js, and it is often very confusing if an application runs differently in different environments. So, it is better to directly configure logging via its own environment variable instead of using an overall variable that configures multiple services. See the Node.js Documentation for a deeper discussion of this topic.
This is a good point to commit and push our work!