Request Logging
Logging Requests with Morgan
Now that we have configured a logging utility, let’s use it to also log all incoming requests sent to our web application. This will definitely make it much easier to keep track of what is going on in our application and make sure it is working correctly.
The Express application generator already installs a library for this, called morgan. We have already seen output from morgan before:
GET / 304 2.569 ms - -
GET /users 200 2.417 ms - 23
GET / 200 1.739 ms - 120
While this is useful, let’s reconfigure morgan to use our new winston logger and add some additional detail to the output.
Since morgan is technically a middleware in our application, let’s create a new folder called middlewares to store configuration for our various middlewares, and then we can create a new middleware file named request-logger.js in that folder. Inside of that file, we can place the following configuration:
import morgan from 'morgan';
import logger from '../configs/logger.js';

// Override morgan stream method to use our custom logger
// Log Format
// :method :url :status :response-time ms - :res[content-length]
const stream = {
    write: (message) => {
        // log using the 'http' severity
        logger.http(message.trim())
    }
}

// See https://github.com/expressjs/morgan?tab=readme-ov-file#api
const requestLogger = morgan('dev', { stream });

export default requestLogger;
In effect, this file basically tells morgan to write output through the logger.http() method instead of just directly to the console. We are importing our winston configuration from configs/logger.js to accomplish this. We are also configuring morgan to use the dev logging format; more information on log formats can be found in the documentation.
Finally, let’s update our app.js file to use this new request logger middleware instead of morgan:
import express from 'express';
import path from 'path';
import cookieParser from 'cookie-parser';
// import logger from 'morgan';
import requestLogger from './middlewares/request-logger.js';

import indexRouter from './routes/index.js';
import usersRouter from './routes/users.js';

var app = express();

// app.use(logger('dev'));
app.use(requestLogger);
app.use(express.json());
app.use(express.urlencoded({ extended: false }));
app.use(cookieParser());
app.use(express.static(path.join(import.meta.dirname, 'public')));

// -=-=- other code omitted here -=-=-
Now, let’s run our application and access a few of the routes via our web browser:
$ npm run devWe should now see output from morgan included as http logs from winston:
> example-project@0.0.1 dev
> LOG_LEVEL=debug node ./bin/www

[2025-01-17 06:39:30.975 PM] info:      Listening on port 3000
[2025-01-17 06:39:37.430 PM] http:      GET / 200 3.851 ms - 120
[2025-01-17 06:39:40.665 PM] http:      GET /users 200 3.184 ms - 23
[2025-01-17 06:39:43.069 PM] http:      GET / 304 0.672 ms - -
[2025-01-17 06:39:45.424 PM] http:      GET /users 304 1.670 ms - -
When viewed on a modern terminal, they should even be colorized!
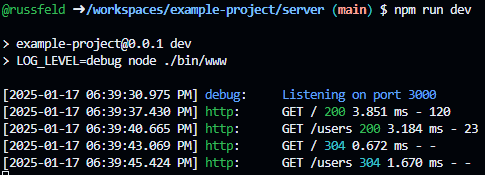
Here, we can see each log level is colorized, and also the HTTP status codes in our morgan log output are also colorized. The first time each page is accessed, the browser receives a 200 status code in green with the content. The second time, our application correctly sends back a 304 status code in light blue, indicating that the content has not been modified and that the browser can use the cached version instead.
This is a good point to commit and push our work!