This example project is the first in a series toward building a complete full-stack web application using Node.js and Express to create a RESTful API on the backend that connects to a database, and then a Vue single page application on the frontend.
In doing so, we’ll explore some of the standard ways web developers use existing tools, frameworks, and libraries to perform many of the operations we’ve learned how to do manually throughout this course. In essence, you’ve already learned how to build these things from scratch, but now we’ll look at how professionals use dependencies to accomplish many of the same things.
We’ll also explore techniques for writing good, clean JavaScript code that includes documentation and API information, unit testing, and more.
Finally, we’ll learn how to do all of this using GitHub Codespaces, so everything runs directly in the web browser with no additional software or hardware needed. Of course, you can also do everything locally using Docker Desktop and Visual Studio Code as well.
Project Deliverables
At the end of this example, we will have a project with the following features:
A working GitHub Codespace containing Node.js
A bare-bones Express application
Update Express application from CommonJS to ES Modules
Application logs with Winston and Morgan
Install other useful Express libraries
A better development server using Nodemon
A tool for managing environment variables
Code documentation with JSDoc and OpenAPI comments
To begin, we will start with an empty GitHub repository. You can either create one yourself, or you may be working from a repository provided through GitHub Classroom.
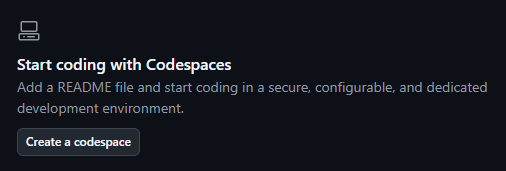
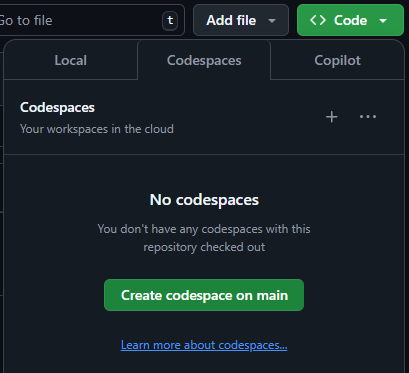
At the top of the page, you may see either a Create a Codespace button in an empty repository, or a Code button that opens a panel with a Codespaces tab and a Create Codespace on main button in an initialized repository. Go ahead and click that button.
Once you do, GitHub will start creating a new GitHub Codespace for your project. This process may take a few moments.
Once it is done, you’ll be presented with a window that looks very similar to Visual Studio Code’s main interface. In fact - it is! It is just a version of Visual Studio Code running directly in a web browser. Pretty neat!
For the rest of this project, we’ll do all of our work here in GitHub Codespaces directly in our web browser.
Working Locally?
If you would rather do this work on your own computer, you’ll need to install the following prerequisites:
For now, you’ll start by cloning your GitHub repository to your local computer, and opening it in Visual Studio Code. We’ll create some configuration files, and then reopen the project using a Dev Container in Docker. When looking in the Command Palette, just swap the “Codespaces” prefix with the “Dev Containers” prefix in the command names.
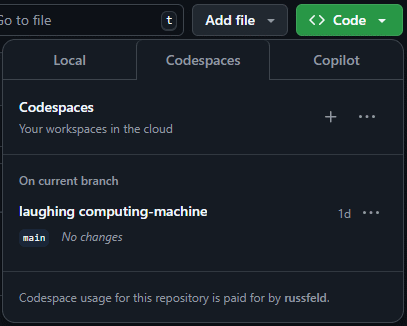
Once you’ve created your GitHub Codespace, you can always find it again by visiting the repository in your web browser, clicking the Code button and choosing the Codespaces tab.
Configuring the Codespace
When we first create a GitHub Codespace, GitHub will use a default dev container configuration. It includes many tools that are preinstalled for working on a wide variety of projects. Inside of the Codespace, you can run the following command in the terminal to get a URL that contains a list of all tools installed and their versions:
$ devcontainer-info content-url
The current default configuration as of this writing can be found here.
Documenting Terminal Commands
In these example projects, we’ll prefix any terminal commands with a dollar sign $ symbol, representing the standard Linux terminal command prompt. You should not enter this character into the terminal, just the content after it. This makes it easy to see individual commands in the documentation, and also makes it easy to tell the difference between commands to be executed and the output produced by that command.
For this project, we are going to configure our own dev container that just contains the tools we need for this project. This also allows us to use the same configuration both in GitHub Codespaces as well as locally on our own systems using Docker.
To configure our own dev container, we first must open the Visual Studio Code Command Palette. We can do this by pressing CTRL+SHIFT+P, or by clicking the top search bar on the page and choosing Show and Run Commands >.
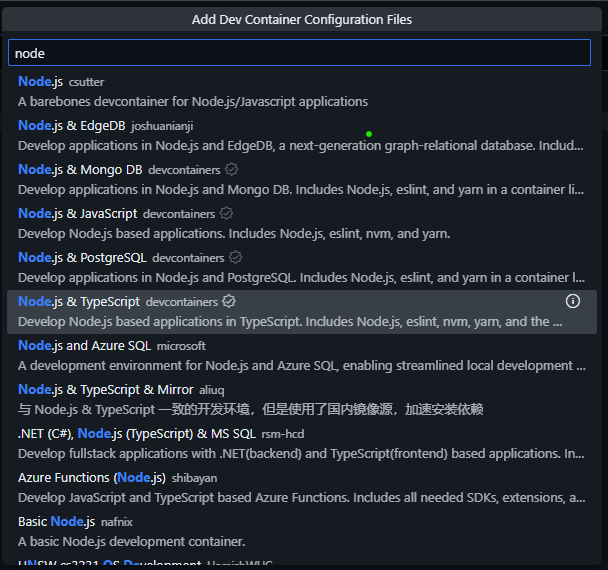
In the Command Palette, search for and choose the Codespaces: Add Dev Container Configuration Files… option, then choose Create a new configuration…. In the list that appears, search for “node” to find the container titled “Node.js & TypeScript” and choose that option.
You’ll then be prompted to choose a version to use. We’ll use 22-bookworm for this project. That refers to Node version 22 LTS running on a Debian Bookworm LTS Linux image. Both of these are current, long term supported (LTS) versions of the software, making them an excellent choice for a new project.
Finally, the last question will ask if we’d like to add any additional features to our dev container configuration. We’ll leave this blank for now, but in the future you may find some of these additional features useful and choose to add them here.
Once that is done, a .devcontainer folder will be created, with a devcontainer.json file inside of it. The content of that file should match what is shown below:
// For format details, see https://aka.ms/devcontainer.json. For config options, see the
// README at: https://github.com/devcontainers/templates/tree/main/src/typescript-node
{
"name":"Node.js & TypeScript",
// Or use a Dockerfile or Docker Compose file. More info: https://containers.dev/guide/dockerfile
"image":"mcr.microsoft.com/devcontainers/typescript-node:1-22-bookworm"// Features to add to the dev container. More info: https://containers.dev/features.
// "features": {},
// Use 'forwardPorts' to make a list of ports inside the container available locally.
// "forwardPorts": [],
// Use 'postCreateCommand' to run commands after the container is created.
// "postCreateCommand": "yarn install",
// Configure tool-specific properties.
// "customizations": {},
// Uncomment to connect as root instead. More info: https://aka.ms/dev-containers-non-root.
// "remoteUser": "root"
}
Over time, we’ll come back to this file to add additional features to our dev container. For now, we’ll just leave it as-is.
Dependabot
You may also see a second file, .github/dependabot.yml that is also created. This file is used by the GitHub Dependabot to keep your dev container configuration up to date. You may get occasional notices from GitHub in the future if there are any updates to software included in your dev container configuration.
At this point, we are ready to rebuilt our GitHub Codespace to use our new dev container configuration. To do this, open the Command Palette once again and look for the Codespaces: Rebuild Container option. Click that option, then select the Full Rebuild option in the popup window since we have completely changed our dev container configuration.
Now, we can sit back and be patient while GitHub Codespaces rebuilds our environment using the new configuration. This may take several minutes.
Once it is complete, we can confirm that Node.js is installed and running the correct version by running the following command and checking the output matches our expected version of Node.js:
$ node --version
v22.12.0
If that works, then our dev container environment in GitHub Codespaces should be set up and ready to go!
Now is a good time to commit our current work to git and push it to GitHub. Even though we are working in a GitHub Codespace, we still have to commit and push our work to get it saved. You can do this using the Source Control sidebar tab on the page, or using the classic terminal commands as shown below.
For the rest of this exercise, we’ll assume that you are comfortable with git and GitHub and can take care of committing and pushing your work yourself, but we’ll give you several hints showing when we hit a good opportunity to save your work.
Now that we have our dev container configured, we can start setting up an Express application. The recommended method in the documentation is to use the Express application generator, so we’ll use that method. You may want to refer to the documentation for this command to see what options are available.
Express Documentation
You may also want to bookmark the Express Documentation website as well, since it contains lots of helpful information about how Express works that may not be covered in this tutorial.
For this project, we’ll use the following command to build our application:
$ npx express-generator --no-view --git server
Let’s break down that command to see what it is doing:
npx - The npx command is included with Node.js and npm and allows us to run a command from an npm package, including packages that aren’t currently installed!. This is the preferred way to run commands that are available in any npm packages.
express-generator - This is the express-generator package in npm that contains the command we are using to build our Express application.
--no-view - This option will generate a project without a built-in view engine.
--git - This option will add a .gitignore file to our project
server - This is the name of the directory where we would like to create our application.
When we run that command, we may be prompted to install the express-generator package, so we can press y to install it.
That command will produce a large amount of output, similar to what is shown below:
Need to install the following packages:
express-generator@4.16.1
Ok to proceed? (y) y

npm warn deprecated mkdirp@0.5.1: Legacy versions of mkdirp are no longer supported. Please update to mkdirp 1.x. (Note that the API surface has changed to use Promises in 1.x.)

   create : server/
   create : server/public/
   create : server/public/javascripts/
   create : server/public/images/
   create : server/public/stylesheets/
   create : server/public/stylesheets/style.css
   create : server/routes/
   create : server/routes/index.js
   create : server/routes/users.js
   create : server/public/index.html
   create : server/.gitignore
   create : server/app.js
   create : server/package.json
   create : server/bin/
   create : server/bin/www

   change directory:
     $ cd server

   install dependencies:
     $ npm install

   run the app:
     $ DEBUG=server:* npm start
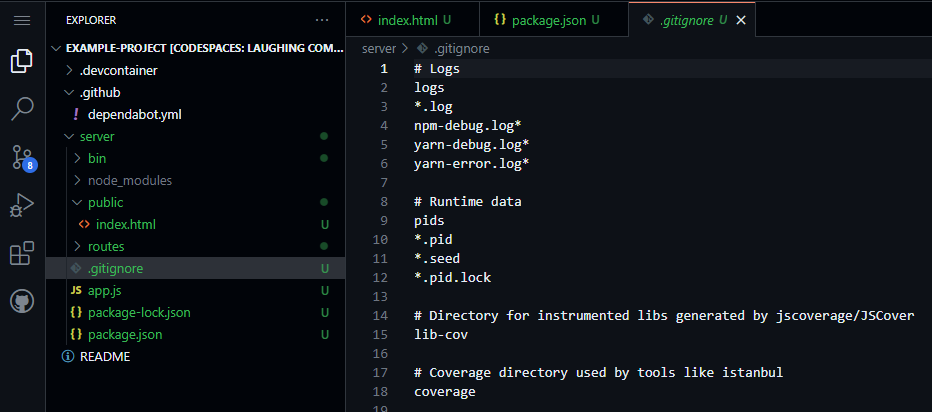
As we can see, it created quite a few files for us! Let’s briefly review what each of these files and folders are for:
public - this folder contains the static HTML, CSS, and JavaScript files that will be served from our application. Much later down the road, we’ll place the compiled version of our Vue frontend application in this folder. For now, it just serves as a placeholder for where those files will be placed.
routes - this folder contains the Express application routers for our application. There are currently only two routers, the index.js router connected to the / path, and the users.js router connected to the /users path.
.gitignore - this file tells git which files or folders can be ignored when committing to the repository. We’ll discuss this file in detail below.
app.js - this is the main file for our Express application. It loads all of the libraries, configurations, and routers and puts them all together into a single Express application.
package.json - this file contains information about the project, including some metadata, scripts, and the list of external dependencies. More information on the structure and content of that file can be found in the documentation.
bin/www - this file is the actual entrypoint for our web application. It loads the Express application defined in app.js, and then creates an http server to listen for incoming connections and sends them to the Express application. It also handles figuring out which port the application should listen on, as well as some common errors.
Since we are only building a RESTful API application, there are a few files that we can delete or quickly modify:
Delete everything in the public folder except the file index.html
Inside of the public/index.html file, remove the line referencing the stylesheet: <link rel="stylesheet" href="/stylesheets/style.css"> since it has been deleted.
At this point, we should also update the contents of the package.json file to describe our project. It currently contains information similar to this:
In a stand-alone application like ours, these values really don’t matter, but if we do decide to publish this application as an npm module in the future, these values will be used to build the module itself.
Exploring App.js
Let’s quickly take a look at the contents of the app.js file to get an idea of what this application does:
At the top, the file loads several libraries, including cookie-parser for parsing cookies sent from the browser, and morgan for logging requests. It then also loads the two routers, index and users.
Next, we see the line var app = express() - this line actually creates the Express application and stores a reference to it in the app variable.
The next few lines add various middlewares to the Express application using the app.use() function. Each of these is effectively a function that is called each time the application receives a request, one after the other, until a response is generated and sent. See Using middleware in the Express documentation for more details.
The last line of that group uses the express.static middleware to serve static files from the public directory (it uses the path library and the __dirname global variable to construct the correct absolute path to those files). So, if the user requests any path that matches a static file, that file will be sent to the user. This will happen even if a static file matches an existing route, since this middleware is added to the application before the routes. So, there are some instances where we may want to connect this middleware to the application after adding some important routes - we’ll discuss that in the future as we continue to build this application.
After that, the two routers are added as well. Each router is given a base path - the index router is given the / path, then the users router is given the /users path. These are the URL paths that are used to determine where each incoming request should be sent in the application. See routing in the Express documentation for more details.
Finally, the Express application referenced in app is exported from this file. It is used by the bin/www file and attached to an http server to listen for incoming requests.
Order Matters
Because Express is a routing and middleware framework, the order in which you add middlewares and routers determines how the application functions. So, we must be very thoughtful about the order in which we add middlewares and routers to our application. In this example, notice, that we add the logger first, then parse any incoming JSON requests, then decode any URL encoded requests, then parse any cookies, before doing anything else.
This is a common error that trips up many first-time Express developers, so be mindful as you add and adjust content in this file!
Installing Dependencies
Now that we’ve generated a basic Express web application, we need to install all of the dependencies. This is also the first step we’ll need to do anytime we clone this project for the first time or if we rebuild our GitHub codespace or dev container.
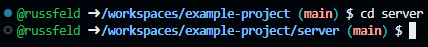
To do this, we need to go to the terminal and change directory to the server folder:
$ cd server
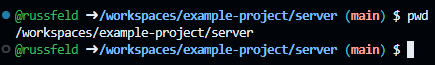
Working Directory
Remember that we can always see the current working directory by looking at the command prompt in the terminal, or by typing the pwd command:
Once inside of the server folder, we can install all our dependencies using the following command:
$ npm install
When we run that command, we’ll see output similar to the following:
added 53 packages, and audited 54 packages in 4s

7 vulnerabilities (3 low, 4 high)

To address all issues, run:
  npm audit fix --force

Run `npm audit` for details.
It looks like we have some out of date packages and vulnerabilities to fix!
Updating Dependencies
Thankfully, there is a very useful command called npm-check-updates that we can use to update our dependencies anytime there is a problem. We can run that package’s command using npx as we saw earlier:
$ npx npm-check-updates
As before, we’ll be prompted to install the package if it isn’t installed already. Once it is done, we’ll see output like this:
Need to install the following packages:
npm-check-updates@17.1.14
Ok to proceed? (y) y

Checking /workspaces/example-project/server/package.json
[====================] 4/4 100%

 cookie-parser   ~1.4.4  →   ~1.4.7
 debug           ~2.6.9  →   ~4.4.0
 express        ~4.16.1  →  ~4.21.2
 morgan          ~1.9.1  →  ~1.10.0

Run npx npm-check-updates -u to upgrade package.json
When we run the command, it tells us which packages are out of date and lists a newer version of the package we can install.
Tread Carefully!
In an actual production application, it is important to make sure your dependencies are kept up to date. At the same time, you’ll want to carefully read the documentation for these dependencies and test your project after any dependency updates, just to ensure that your application works correctly using the new versions.
For example, in the output above, we see this:
debug ~2.6.9 → ~4.4.0
This means that the debug library is two major versions out of date (see Semantic Versioning for more information on how to interpret version numbers)! If we check the debug versions list on npm, we can see that version 2.6.9 was released in September 2017 - a very long time ago.
When a package undergoes a major version change, it often comes with incompatible API changes. So, we may want to consult the documentation for each major version or find release notes or upgrade guides to refer to. In this case, we can refer to the release notes for each version on GitHub:
We may even need to check some of the release notes for minor releases as well.
Thankfully, the latest version of the debug library is compatible with our existing code, and later in this project we’ll replace it with a better logging infrastructure anyway.
Now that we know which dependencies can be updated, we can use the same command with the -u option to update our package.json file easily:
$ npx npm-check-updates -u
We should see output similar to this:
Upgrading /workspaces/example-project/server/package.json
[====================] 4/4 100%

 cookie-parser   ~1.4.4  →   ~1.4.7
 debug           ~2.6.9  →   ~4.4.0
 express        ~4.16.1  →  ~4.21.2
 morgan          ~1.9.1  →  ~1.10.0

Run npm install to install new versions.
We can also check our package.json file to see the changes:
Now when we run that command, we should see that everything is up to date!
added 36 packages, changed 24 packages, and audited 90 packages in 4s

14 packages are looking for funding
  run `npm fund` for details

found 0 vulnerabilities
There we go! We now have a sample Express application configured with updated dependencies.
Testing the Application
At this point, we are ready to actually test our application. To do this, we can run the following command from within the server directory in our project:
$ npm start
When we do, we’ll see a bit of information on the terminal:
> example-project@0.0.1 start
> node ./bin/www
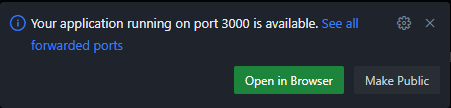
We’ll also see a small popup in the bottom right corner of the screen, telling us that it has detected that our application is listening on port 3000.
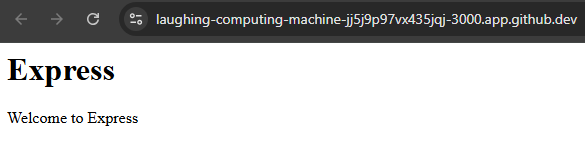
So, to access our application, we can click on the Open in Browser button on that popup. If everything works correctly, we should be able to see our application running in our web browser:
Take a look at the long URL in the browser - that URL includes the name of the GitHub Codespace (laughing-computing-machine in this example), followed by a random Codespace ID (jj5j9p97vx435jqj), followed by the port our application is listening on (3000). We’ll look at ways we can build this URL inside of our application in the future, but for now it is just worth noting.
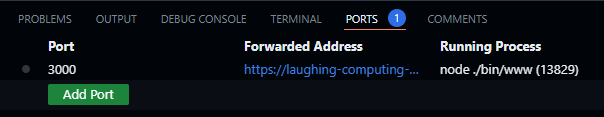
Finding Listening Ports
If you didn’t see the popup appear, or you cannot find where your application is running, check the PORTS tab above the console in GitHub Codespaces:
We can click on the URL under the Forwarded Addresses heading to access the port in our web browser. We can also use this interface to configure additional ports that we want to be able to access outside of the GitHub Codespace.
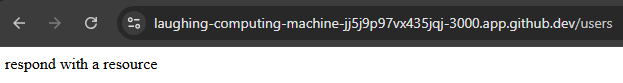
We can also access any routes that are configured in our application. For example, the default Express application includes a /users route, so we can just add /users to the end of the URL in our web browser to access it. We should see this page when we do:
Great! It looks like our example application in running correctly.
Committing to GitHub
Now is a great time to commit and push our project to GitHub. Before we do, however, we should double-check that our project has a proper server/.gitignore file. It should have been created by the Express application generator if we used the --git option, but it is always important to double-check that it is there before trying to commit a new project.
A .gitignore file is used to tell git which files should not be committed to a repository. For a project using Node.js, we especially don’t want to commit our node_modules folder. This folder contains all of the dependencies for our project, and can often be very large.
Why don’t we want to commit it? Because it contains lots of code that isn’t ours, and it is much better to just install the dependencies locally whenever we develop or use our application. That is the whole function of the package.json file and the npm command - it lets us focus on only developing our own code, and it will find and manage all other external dependencies for us.
So, as a general rule of thumb, we should NEVER commit the node_modules folder to our repository.
Missing gitignore file?
If your project does not have a .gitignore file, you can usually find one for the language or framework you are using in the excellent gitignore GitHub Repository. Just look for the appropriate file and add the contents to a .gitignore file in your project. For example, you can find a Node.gitignore file to use in this project.
At long last, we are ready to commit and push all of our changes to this project. If it works correctly, it should only commit the code files we’ve created, but none of the files that are ignored in the .gitignore file.
By default, the Express application generator creates an application using the CommonJS module format. This is the original way that JavaScript modules were packaged. However, many libraries and frameworks have been moving to the new ECMAScript module format (commonly referred to as ES modules), which is current official standard way of packaging JavaScript modules.
Since we want to build an industry-grade application, it would be best to update our application to use the new ES module format. This format will become more and more common over time, and many dependencies on npm have already started to shift to only supporting the ES module format. So, let’s take the time now to update our application to use that new format before we go any further.
Enabling ES Module Support
To enable ES module support in our application, we must simply add "type": "module", to the package.json file:
> example-project@0.0.1 start
> node ./bin/www

file:///workspaces/example-project/server/bin/www:7
var app = require('../app');
          ^

ReferenceError: require is not defined in ES module scope, you can use import instead
    at file:///workspaces/example-project/server/bin/www:7:11
    at ModuleJob.run (node:internal/modules/esm/module_job:271:25)
    at async onImport.tracePromise.__proto__ (node:internal/modules/esm/loader:547:26)
    at async asyncRunEntryPointWithESMLoader (node:internal/modules/run_main:116:5)

Node.js v22.12.0
By changing that one line in package.json, the Node.js runtime is trying to load our project using ES modules instead of CommonJS modules, and it causes all sorts of errors. Thankfully, most of them are easy to fix! In most cases, we are simply making two updates:
Replacing require statements with import statements
Replacing module.exports statements with export default statements.
Let’s go file by file and make these updates. We’ll only show the lines that are commented out and their replacements directly below - you’ll need to look carefully at each file, find the commented line, and replace it with the new line.
bin/www
// var app = require('../app');
importappfrom'../app.js';
// var debug = require('debug')('server:server');
importdebugLibraryfrom'debug';
constdebug=debugLibrary('server:server');
// var http = require('http');
importhttpfrom'http';
app.js
// var express = require('express');
importexpressfrom'express';
// var path = require('path');
importpathfrom'path';
// var cookieParser = require('cookie-parser');
importcookieParserfrom'cookie-parser';
// var logger = require('morgan');
importloggerfrom'morgan';
// var indexRouter = require('./routes/index');
importindexRouterfrom'./routes/index.js';
// var usersRouter = require('./routes/users');
importusersRouterfrom'./routes/users.js';
// -=-=- other code omitted here -=-=-
//module.exports = app;
exportdefaultapp;
routes/index.js and routes/users.js
// var express = require('express');
importexpressfrom'express';
// var router = express.Router();
constrouter=express.Router();
// -=-=- other code omitted here -=-=-
// module.exports = router;
exportdefaultrouter;
At this point, let’s test our application again to see if we’ve updated everything correctly:
$ npm start
Now, we should get an error message similar to this:
file:///workspaces/example-project/server/app.js:25
app.use(express.static(path.join(__dirname, 'public')));
                                 ^

ReferenceError: __dirname is not defined in ES module scope
    at file:///workspaces/example-project/server/app.js:25:34
    at ModuleJob.run (node:internal/modules/esm/module_job:271:25)
    at async onImport.tracePromise.__proto__ (node:internal/modules/esm/loader:547:26)
    at async asyncRunEntryPointWithESMLoader (node:internal/modules/run_main:116:5)

Node.js v22.12.0
This is a bit trickier to debug, but a quick Google search usually leads to the correct answer. In this case, the __dirname variable is a global variable that is defined when Node.js is running a CommonJS module, as discussed in the documentation. However, when Node.js is running an ES module, many of these global variables have been relocated to the import.meta property, as shown in the documentation. So, we can just replace __dirname with the import.meta.dirname variable in app.js:
Let’s try to run our application again - it should be able to start this time:
$ npm start
Updating a Node.js application to use ES modules is not terribly difficult, especially if it is done early in development. However, since we’ve made this change, we’ll have to be careful as we continue to develop our application. Many online tutorials, documentation, and references assume that any Node.js and Express application is still using CommonJS modules, so we may have to translate any code we find to match our new ES module setup.
Now that we have a basic Express application, let’s add some helpful tools for developers to make our application easier to work with and debug in the future. These are some great quality of life tweaks that many professional web applications include, but often new developers fail to add them early on in development and waste lots of time adding them later. So, let’s take some time now to add these features before we start developing any actual RESTful endpoints.
First, you may have noticed that the bin/www file includes the debug utility. This is a very common debugging module that is included in many Node.sj applications, and is modeled after how Node.js itself handles debugging internally. It is a very powerful module, and one that you should make use of anytime you are creating a Node.js library to be published on npm and shared with others.
Let’s quickly look at how we can use the debug utility in our application. Right now, when we start our application, we see very little output on the terminal:
$ npm start
That command produces this output:
> example-project@0.0.1 start
> node ./bin/www
As we access various pages and routes, we may see some additional lines of output appear, like this:
GET / 304 2.569 ms - -
GET /users 200 2.417 ms - 23
GET / 200 1.739 ms - 120
These lines come from the morgan request logging middleware, which we’ll discuss on the next page of this example.
To enable the debug library, we simply must set an environment variable in the terminal when we run our application, as shown here:
$ DEBUG=* npm start
Environment Variables
An environment variable is a value that is present in memory in a running instance of an operating system. These generally give running processes information about the system, but may also include data and information provided by the user or system administrator. Environment variables are very common ways to configure applications that run in containers, like our application will when it is finally deployed. We’ll cover this in detail later in this course; for now, just understand that we are setting a variable in memory that can be accessed inside of our application.
Now, we’ll be provided with a lot of debugging output from all throughout our application:
> example-project@0.0.1 start
> node ./bin/www

  express:router:route new '/' +0ms
  express:router:layer new '/' +1ms
  express:router:route get '/' +0ms
  express:router:layer new '/' +1ms
  express:router:route new '/' +0ms
  express:router:layer new '/' +0ms
  express:router:route get '/' +0ms
  express:router:layer new '/' +0ms
  express:application set "x-powered-by" to true +1ms
  express:application set "etag" to 'weak' +0ms
  express:application set "etag fn" to [Function: generateETag] +0ms
  express:application set "env" to 'development' +0ms
  express:application set "query parser" to 'extended' +0ms
  express:application set "query parser fn" to [Function: parseExtendedQueryString] +0ms
  express:application set "subdomain offset" to 2 +0ms
  express:application set "trust proxy" to false +0ms
  express:application set "trust proxy fn" to [Function: trustNone] +1ms
  express:application booting in development mode +0ms
  express:application set "view" to [Function: View] +0ms
  express:application set "views" to '/workspaces/example-project/server/views' +0ms
  express:application set "jsonp callback name" to 'callback' +0ms
  express:router use '/' query +1ms
  express:router:layer new '/' +0ms
  express:router use '/' expressInit +0ms
  express:router:layer new '/' +0ms
  express:router use '/' logger +0ms
  express:router:layer new '/' +0ms
  express:router use '/' jsonParser +0ms
  express:router:layer new '/' +0ms
  express:router use '/' urlencodedParser +1ms
  express:router:layer new '/' +0ms
  express:router use '/' cookieParser +0ms
  express:router:layer new '/' +0ms
  express:router use '/' serveStatic +0ms
  express:router:layer new '/' +0ms
  express:router use '/' router +0ms
  express:router:layer new '/' +1ms
  express:router use '/users' router +0ms
  express:router:layer new '/users' +0ms
  express:application set "port" to 3000 +2ms
  server:server Listening on port 3000 +0ms
Each line of output starts with a package name, such as express:application showing the namespace where the logging message came from (which usually corresponds to the library or module it is contained in), followed by the message itself. The last part of the line looks like +0ms, and is simply a timestamp showing the time elapsed since the last debug message was printed.
At the very bottom we see the debug line server:server Listening on port 3000 +0ms - this line is what is actually printed in the bin/www file. Let’s look at that file and see where that comes from:
// -=-=- other code omitted here -=-=-
importdebugLibraryfrom'debug';
constdebug=debugLibrary('server:server');
// -=-=- other code omitted here -=-=-
functiononListening() {
varaddr=server.address();
varbind=typeofaddr==='string'?'pipe '+addr:'port '+addr.port;
debug('Listening on '+bind);
}
At the top of that file, we import the debug library, and then instantiate it using the name 'server:server'. This becomes the namespace for our debug messages printed using this instance of the debug library. Then, inside of the onListening() function, we call the debug function and provide a message to be printed.
When we run our application, we can change the value of the DEBUG environment variable to match a particular namespace to only see messages from that part of our application:
$ $ DEBUG=server:* npm start
This will only show output from our server namespace:
> example-project@0.0.1 start
> node ./bin/www

  server:server Listening on port 3000 +0ms
The debug utility is a very powerful tool for diagnosing issues with a Node.js and Express application. You can learn more about how to use and configure the debug utility in the documentation.
Logging with Winston
However, since we are focused on creating a web application and not a library, let’s replace debug with the more powerful winston logger. This allows us to create a robust logging system based on the traditional concept of severity levels of the logs we want to see.
To start, let’s install winston using the npm command (as always, we should make sure we are working in the server directory of our application):
$ npm install winston
We should see output similar to the following:
added 28 packages, and audited 118 packages in 2s

15 packages are looking for funding
  run `npm fund` for details

found 0 vulnerabilities
Multiple Dependencies
Notice how installing a single dependency actually installed 28 individual packages? This is a very useful feature of how Node.js and npm packages are structured, since each package can focus on doing only one task really well while reusing common tools and utilities that other packages may also use (thereby reducing the number of duplicated packages that may need to be installed). Unfortunately, this can also lead to situations where an issue with a single package can cause cascading failures and incompatibilities across the board. So, while it is very helpful to install these dependencies in our application, we always want to do so with caution and make sure are always using dependencies that are well maintained and actually add value to our application.
The left-pad Incident
For a vivid case study of the concerns around using unnecessary dependencies, look at the npm left-pad incident. The left-pad library was a simple utility that added padding to the left side of a string. The entire library itself was a single function that contained less than 10 lines of actual code. However, when the developer of that library removed access to it due to a dispute, it ended up nearly breaking the entire npm ecosystem. Core development tools such as Babel, Webpack and more all used that library as a dependency, and with the rise of automated build systems, each tool broke as soon as the next rebuild cycle was initiated. It also caused issues with major online platforms such as Facebook, PayPal, Netflix, and Spotify.
Even today, nearly 9 years after the incident, the left-pad library is still present on npm, even though it is listed as deprecated since JavaScript now includes a method String.prototype.padStart() that performs the same action. As of January 2025, there are still 540 libraries on npm that list left-pad as a dependency, and it is downloaded over 1 million times per week!
Now that we’ve installed winston, we should configure it. We could place all of the code to configure it inside of each file where it is used, but let’s instead create a standalone configuration file for winston that we can use throughout our application.
To do this, let’s create a new folder named configs inside of our server folder to house configurations for various dependencies, and then inside of that folder create a new file named logger.js for this configuration. In that file, we can place the following content:
importwinstonfrom'winston';
const { combine, timestamp, printf, colorize, align, errors } =winston.format;
// Log Levels
// error: 0
// warn: 1
// info: 2
// http: 3
// verbose: 4
// debug: 5
// silly: 6
functionlevel () {
if (process.env.LOG_LEVEL) {
if (process.env.LOG_LEVEL==='0'||process.env.LOG_LEVEL==='error') {
return'error';
}
if (process.env.LOG_LEVEL==='1'||process.env.LOG_LEVEL==='warn') {
return'warn';
}
if (process.env.LOG_LEVEL==='2'||process.env.LOG_LEVEL==='info') {
return'info';
}
if (process.env.LOG_LEVEL==='3'||process.env.LOG_LEVEL==='http') {
return'http';
}
if (process.env.LOG_LEVEL==='4'||process.env.LOG_LEVEL==='verbose') {
return'verbose';
}
if (process.env.LOG_LEVEL==='5'||process.env.LOG_LEVEL==='debug') {
return'debug';
}
if (process.env.LOG_LEVEL==='6'||process.env.LOG_LEVEL==='silly') {
return'silly';
}
}
return'http';
}
constlogger=winston.createLogger({
// call `level` function to get default log level
level:level(),
// Format configuration
format:combine(
colorize({ all:true }),
errors({ stack:true}),
timestamp({
format:'YYYY-MM-DD hh:mm:ss.SSS A',
}),
align(),
printf((info) => `[${info.timestamp}] ${info.level}: ${info.stack?info.message+"\n"+info.stack:info.message}`)
),
// Output configuration
transports: [newwinston.transports.Console()]
})
exportdefaultlogger;
At the top, we see a helpful comment just reminding us which log levels are available by default in winston. Then, we have a level function that determines what our desired log level should be based on an environment variable named LOG_LEVEL. We’ll set that variable a bit later in this tutorial. Based on that log level, our system will print any logs at that level or lower in severity level. Finally, we create an instance of the winston logger and provide lots of configuration information about our desired output format. All of this is highly configurable. To fully understand this configuration, take some time to review the winston documentation.
Now, let’s update our bin/www file to use this logger instead of the debug utility. Lines that have been changed are highlighted:
// -=-=- other code omitted here -=-=-
// var debug = require('debug')('server:server');
// import debugLibrary from 'debug';
// const debug = debugLibrary('server:server');
importloggerfrom'../configs/logger.js';
// -=-=- other code omitted here -=-=-
functiononError(error) {
if (error.syscall!=='listen') {
throwerror;
}
varbind=typeofport==='string'?'Pipe '+port:'Port '+port;
// handle specific listen errors with friendly messages
switch (error.code) {
case'EACCES':// console.error(bind + ' requires elevated privileges');
logger.error(new Error(bind+' requires elevated privileges'));
process.exit(1);
break;
case'EADDRINUSE':// console.error(bind + ' is already in use');
logger.error(new Error(bind+' is already in use'));
process.exit(1);
break;
default:throwerror;
}
}
/**
* Event listener for HTTP server "listening" event.
*/functiononListening() {
varaddr=server.address();
varbind=typeofaddr==='string'?'pipe '+addr:'port '+addr.port;
// debug('Listening on ' + bind);
logger.debug('Listening on '+bind)
}
Basically, we’ve replaced all instances of the debug method with logger.debug. We’ve also replaced a couple of uses of console.error to instead use logger.error. They will also create new Error object, which will cause winston to print a stack trace as well.
With that change in place, we can now remove the debug utility from our list of dependencies:
$ npm uninstall debug
Now, let’s run our program to see winston in action:
$ npm start
When we run it, we should see this output:
> example-project@0.0.1 start
> node ./bin/www
Notice how winston didn’t print any debug messages? That is because we haven’t set our LOG_LEVEL environment variable. So, let’s do that by creating two different scripts in our package.json file - one to run the application with a default log level, and another to run it with the debug log level:
The npm run command can be used to run any of the scripts in the scripts section of our package.json file.
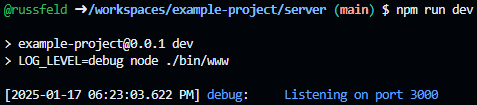
So, if we want to run our application so we can see the debug messages, we can use the following command:
$ npm run dev
Now we should see some debug messages in the output:
> example-project@0.0.1 dev
> LOG_LEVEL=debug node ./bin/www

[2025-01-17 06:23:03.622 PM] info:      Listening on port 3000
Great! Notice how the logger outputs a timestamp, the log level, and the message, all on the same line? This matches the configuration we used in the configs/logger.js file. On most terminals, each log level will even be a different color!
Finally, since we really should make sure the message that the application is successfully listening on a port is printed by default, let’s change it to the info log level in our bin/www file:
// -=-=- other code omitted here -=-=-
functiononListening() {
varaddr=server.address();
varbind=typeofaddr==='string'?'pipe '+addr:'port '+addr.port;
// debug('Listening on ' + bind);
logger.info('Listening on '+bind)
}
Why Not Use NODE_ENV?
In many web applications written using Node.js and Express, you may have come across the NODE_ENV environment variable, which is often set to either development, production, or sometimes test to configure the application. While this may have made sense in the past, it is now considered an anti-pattern in Node.js. This is because there no fundamental difference between development and production in Node.js, and it is often very confusing if an application runs differently in different environments. So, it is better to directly configure logging via its own environment variable instead of using an overall variable that configures multiple services. See the Node.js Documentation for a deeper discussion of this topic.
Now that we have configured a logging utility, let’s use it to also log all incoming requests sent to our web application. This will definitely make it much easier to keep track of what is going on in our application and make sure it is working correctly.
The Express application generator already installs a library for this, called morgan. We have already seen output from morgan before:
GET / 304 2.569 ms - -
GET /users 200 2.417 ms - 23
GET / 200 1.739 ms - 120
While this is useful, let’s reconfigure morgan to use our new winston logger and add some additional detail to the output.
Since morgan is technically a middleware in our application, let’s create a new folder called middlewares to store configuration for our various middlewares, and then we can create a new middleware file named request-logger.js in that folder. Inside of that file, we can place the following configuration:
importmorganfrom'morgan';
importloggerfrom'../configs/logger.js';
// Override morgan stream method to use our custom logger
// Log Format
// :method :url :status :response-time ms - :res[content-length]
conststream= {
write: (message) => {
// log using the 'http' severity
logger.http(message.trim())
}
}
// See https://github.com/expressjs/morgan?tab=readme-ov-file#api
constrequestLogger=morgan('dev', { stream });
exportdefaultrequestLogger;
In effect, this file basically tells morgan to write output through the logger.http() method instead of just directly to the console. We are importing our winston configuration from configs/logger.js to accomplish this. We are also configuring morgan to use the dev logging format; more information on log formats can be found in the documentation.
Finally, let’s update our app.js file to use this new request logger middleware instead of morgan:
importexpressfrom'express';
importpathfrom'path';
importcookieParserfrom'cookie-parser';
// import logger from 'morgan';
importrequestLoggerfrom'./middlewares/request-logger.js';
importindexRouterfrom'./routes/index.js';
importusersRouterfrom'./routes/users.js';
varapp=express();
// app.use(logger('dev'));
app.use(requestLogger);
app.use(express.json());
app.use(express.urlencoded({ extended:false }));
app.use(cookieParser());
app.use(express.static(path.join(import.meta.dirname, 'public')));
// -=-=- other code omitted here -=-=-
Now, let’s run our application and access a few of the routes via our web browser:
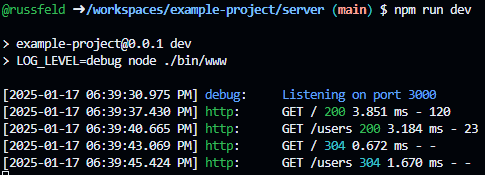
$ npm run dev
We should now see output from morgan included as http logs from winston:
> example-project@0.0.1 dev
> LOG_LEVEL=debug node ./bin/www

[2025-01-17 06:39:30.975 PM] info:      Listening on port 3000
[2025-01-17 06:39:37.430 PM] http:      GET / 200 3.851 ms - 120
[2025-01-17 06:39:40.665 PM] http:      GET /users 200 3.184 ms - 23
[2025-01-17 06:39:43.069 PM] http:      GET / 304 0.672 ms - -
[2025-01-17 06:39:45.424 PM] http:      GET /users 304 1.670 ms - -
When viewed on a modern terminal, they should even be colorized!
Here, we can see each log level is colorized, and also the HTTP status codes in our morgan log output are also colorized. The first time each page is accessed, the browser receives a 200 status code in green with the content. The second time, our application correctly sends back a 304 status code in light blue, indicating that the content has not been modified and that the browser can use the cached version instead.
Before we move on, let’s install a few other useful libraries that perform various tasks in our Express application.
Compression
The compression middleware library does exactly what it says it will - it compresses any responses generated by the server and sent through the network. This can be helpful in many situations, but not all. Recall that compression is really just trading more processing time in exchange for less network bandwidth, so we may need to consider which of those we are more concerned about. Thankfully, adding or removing the compression middleware library is simple.
First, let’s install it using npm:
$ npm install compression
Then, we can add it to our app.js file, generally early in the chain of middlewares since it will impact all responses after that point in the chain.
To test this library, we can run our application with all built-in debugging enabled through the debug library as documented in the Express Documentation:
$ DEBUG=* npm run dev
We’ll see a bunch of output as our Express application is initialized. Once it is done, we can open the home page in our web browser to send an HTTP GET request to the server. This will produce the following log output:
We can see in the highlighted line that the compression library did not apply any compression to the response because it was below the minium size threshold. This is set to 1kb by default according to the compression documentation.
So, to really see what it does, let’s generate a much larger response by adding some additional text to our public/index.html file (this text was generated using Lorem Ipsum):
<html>

<head>
  <title>Express</title>
</head>

<body>
  <h1>Express</h1>
  <p>Welcome to Express</p>

  <p>Lorem ipsum dolor sit amet, consectetur adipiscing elit. Aliquam sed arcu tincidunt, porttitor diam a, porta nibh. Duis pretium tellus euismod, imperdiet elit id, gravida turpis. Fusce vitae pulvinar tellus. Donec cursus pretium justo, sed vehicula erat iaculis lobortis. Mauris dapibus scelerisque aliquet. Nullam posuere, magna vitae viverra lacinia, sapien magna imperdiet erat, ac sagittis ante ante tristique eros. Phasellus eget fermentum mauris. Integer justo lorem, finibus a ullamcorper in, feugiat in nunc. Etiam ut felis a magna aliquam consectetur. Duis eu mauris ut leo vehicula fringilla scelerisque vel mi. Donec placerat quam nulla, at commodo orci maximus sit amet. Curabitur tincidunt euismod enim, non feugiat nulla eleifend sed. Sed finibus metus sit amet metus congue commodo. Cras ullamcorper turpis sed mi scelerisque porta.</p>

  <p>Sed maximus diam in blandit elementum. Integer diam ante, tincidunt in pulvinar at, luctus in dui. Fusce tincidunt hendrerit dolor in suscipit. Nullam vitae tellus at justo bibendum blandit a vel ligula. Nunc sed augue blandit, finibus nisi nec, posuere orci. Maecenas ut egestas diam. Donec non orci nec ex rhoncus malesuada at eget ante. Proin ultricies cursus nunc eu mollis. Donec vel ligula vel eros luctus pulvinar. Proin vitae dui imperdiet, rutrum risus non, maximus purus. Vivamus fringilla augue tincidunt, venenatis arcu eu, dictum nunc. Mauris eu ullamcorper orci. Cras efficitur egestas ligula. Maecenas a nisl bibendum turpis tristique lobortis.</p>

</body>

</html>
Now, when we request that file, we should see this line in our debug output:
As we can see, the compression middleware is now compressing the response before it is sent to the server using the gzip compression algorithm. We can also see this in our web browser’s debugging tools - in Google Chrome, we notice that the Content-Encoding header is set to gzip as shown below:
We’ll go ahead and integrate the compression middleware into our project for this course, but as discussed above, it is always worth considering whether the tradeoff of additional processing time to save network bandwidth is truly worth it.
Helmet
Another very useful Express library is helmet. Helmet sets several headers in the HTTP response from an Express application to help improve security. This includes things such as setting an appropriate Content-Security-Policy and removing information about the web server that could be leaked in the X-Powered-By header.
To install helmet we can simply use npm as always:
$ npm install helmet
Similar to the compression library above, we can simply add helmet to our Express application’s app.js file:
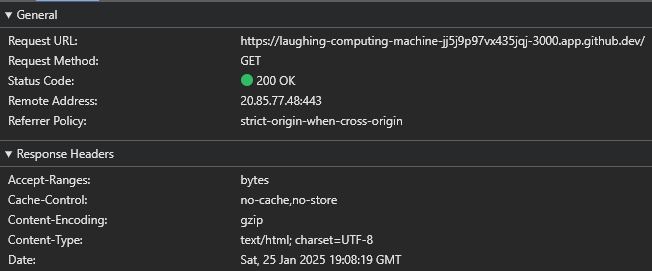
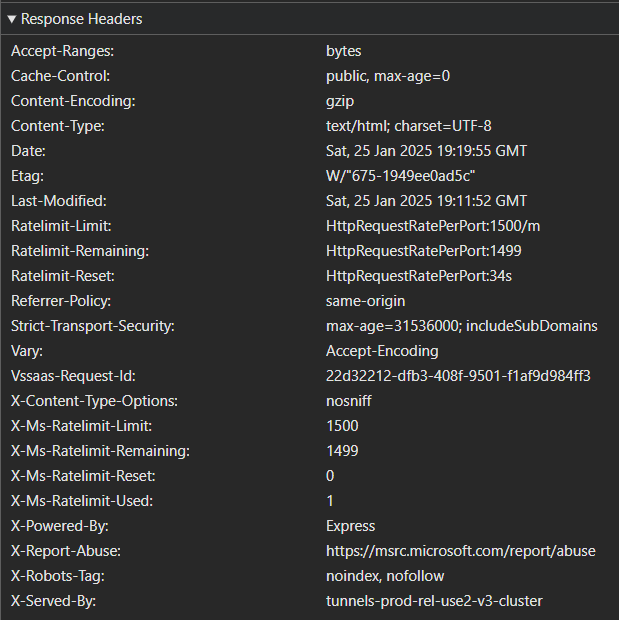
To really see what the helmet library does, we can examine the headers sent by the server with and without helmet enabled.
First, here are the headers sent by the server without helmet enabled:
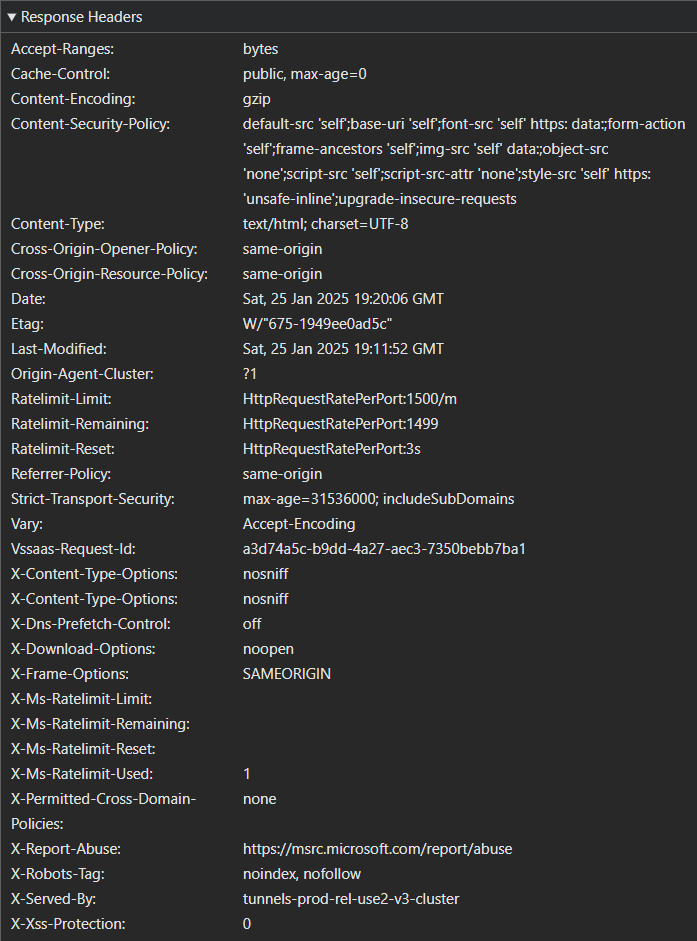
When helmet is enabled, we see an entirely different set of headers:
In the second screenshot, notice that the Content-Security-Policy header is now present, but the X-Powered-By header is not? Those changes, along with many others, are provided by the helmet library.
In general, it is always a good idea to review the security of the headers sent by our application. Installing helmet is a good start, but as we continue to develop applications we may learn additional ways we can configure helmet to provide even more security for our applications.
Nodemon
Finally, let’s also install the nodemon package to make developing our application a bit easier. At its core, nodemon is a simple tool that will auotmatically restart our application anytime it detects that a file has changed. In this way, we can just leave our application running in the background, and any changes we make to the code will immediately be availbale for us to test without having to manually restart the server.
To begin, let’s install nodemon as a development dependency using npm with the --save-dev flag:
$ npm install nodemon --save-dev
Notice that this will cause that library to be installed in a new section of our package.json file called devDependencies:
These dependencies are only installed by npm when we are developing our application. The default npm install command will install all dependencies, including development dependencies. However, we can instead either use npm install --omit=dev or set the NODE_ENV environment variable to production to avoid installing development dependencies.
Next, we can simply update our package.json file to use the nodemon command instead of node in the dev script:
We should see additional output from nodemon to see that it is working:
> example-project@0.0.1 dev
> LOG_LEVEL=debug nodemon ./bin/www

[nodemon] 3.1.9
[nodemon] to restart at any time, enter `rs`
[nodemon] watching path(s): *.*
[nodemon] watching extensions: js,mjs,cjs,json
[nodemon] starting `node ./bin/www`
[2025-01-25 09:37:24.734 PM] info:      Listening on port 3000
Now, with our application running, we can make any change to a file in our application, such as app.js, and it will automatically restart our application:
[nodemon] restarting due to changes...
[nodemon] starting `node ./bin/www`
[2025-01-25 09:39:02.858 PM] info:      Listening on port 3000
We can also always manually type rs in the terminal to restart the application when it is running inside of nodemon.
In general, using nodemon to develop a Node.js application is recommended, but we don’t want to use that in a production environment. So, we are careful to install nodemon as a development dependency only.
As discussed earlier, an environment variable is a value present in memory in the operating system environment where a process is running. They contain important information about the system where the application is running, but they can also be configured by the user or system administrator to provide information and configuration to any processes running in that environment. This is especially used when working with containers like the dev container we built for this project.
To explore this, we can use the printenv command in any Linux terminal:
$ printenv
When we run that command in our GitHub codespace, we’ll see output containing lines similar to this (many lines have been omitted as they contain secure information):
As we can see, the environment contains many useful variables, including a CODESPACES variable showing that the application is running in GitHub Codespaces. We can also find our GITHUB_USER, CODESPACE_NAME and even the NODE_VERSION all in the environment.
Configuring the Environment
Because many web applications eventually run in a containerized environment anyway, it is very common practice to configure those applications through the use of environment variables. Thankfully, we can more easily control and configure our application through the use of a special library dotenvx that allows us to load a set of environment variables from a file named .env.
dotenv
The dotenvx library is a newer version of the dotenv library that has been used for this purpose for many years. dotenvx was developed by the same developer, and is often recommended as a new, modern replacement to dotenv for most users. It includes features that allow us to create multiple environments and even encrypt values. So, for this project we’ll use the newer library to take advantage of some of those features.
To begin, let’s install dotenvx using npm:
$ npm install @dotenvx/dotenvx
Next, we’ll need to import that library as early as possible in our application, since we want to make sure that the environment is properly loaded before any other configuration files are referenced, since they may require environment variables to work properly. In this case, we want to do that as the very first thing in app.js:
import'@dotenvx/dotenvx/config';
importexpressfrom'express';
importpathfrom'path';
importcookieParserfrom'cookie-parser';
importcompressionfrom'compression';
importhelmetfrom'helmet';
importrequestLoggerfrom'./middlewares/request-logger.js';
// -=-=- other code omitted here -=-=-
Now, when we run our application, we should get a helpful message letting us know that our environment file is missing:
> example-project@0.0.1 dev
> LOG_LEVEL=debug nodemon ./bin/www

[nodemon] 3.1.9
[nodemon] to restart at any time, enter `rs`
[nodemon] watching path(s): *.*
[nodemon] watching extensions: js,mjs,cjs,json
[nodemon] starting `node ./bin/www`
[MISSING_ENV_FILE] missing .env file (/workspaces/example-project/server/.env)
[MISSING_ENV_FILE] https://github.com/dotenvx/dotenvx/issues/484
[dotenvx@1.34.0] injecting env (0)
[2025-01-25 08:15:56.135 PM] info:      Listening on port 3000
This is one of the many benefits that comes from using the newer dotenvx library - it will helpfully remind us when we are running without an environment file, just in case we forgot to create one.
So, now let’s create the .env file in the server folder of our application, and add an environment variable to that file:
LOG_LEVEL=error
This should set the logging level of our application to error, meaning that only errors will be logged to the terminal. So, let’s run our application and see what it does:
$ npm run dev
However, when we do, we notice that we are still getting http logging in the output:
> example-project@0.0.1 dev
> LOG_LEVEL=debug nodemon ./bin/www

[nodemon] 3.1.9
[nodemon] to restart at any time, enter `rs`
[nodemon] watching path(s): *.*
[nodemon] watching extensions: js,mjs,cjs,json
[nodemon] starting `node ./bin/www`
[dotenvx@1.34.0] injecting env (0) from .env
[2025-01-25 08:20:17.438 PM] info:      Listening on port 3000
[2025-01-25 08:23:56.896 PM] http:      GET / 304 3.405 ms -
This is because we are already setting the LOG_LEVEL environment variable directly in our package.json file:
This is actually a great feature! The dotenvx library will not override any existing environment variables - so, if the environment is already configured, or we want to override anything that may be present in our .env file, we can just set it in the environment before running our application, and those values will take precedence!
For now, let’s go ahead and remove that variable from the dev script in our package.json file:
Now, when we run our program, we should not see any logging output (unless we can somehow cause the server to raise an error, which is unlikely right now):
> example-project@0.0.1 dev
> nodemon ./bin/www

[nodemon] 3.1.9
[nodemon] to restart at any time, enter `rs`
[nodemon] watching path(s): *.*
[nodemon] watching extensions: js,mjs,cjs,json
[nodemon] starting `node ./bin/www`
[dotenvx@1.34.0] injecting env (1) from .env
Finally, let’s go ahead and set the value in our .env file back to the debug setting:
LOG_LEVEL=debug
Now, when we run our application, we can see that it is following that configuration:
> example-project@0.0.1 dev
> nodemon ./bin/www

[nodemon] 3.1.9
[nodemon] to restart at any time, enter `rs`
[nodemon] watching path(s): *.*
[nodemon] watching extensions: js,mjs,cjs,json
[nodemon] starting `node ./bin/www`
[dotenvx@1.34.0] injecting env (1) from .env
[2025-01-25 08:28:54.587 PM] info:      Listening on port 3000
[2025-01-25 08:28:58.625 PM] http:      GET / 200 3.475 ms - -
Great! We now have a powerful way to configure our application using a .env file.
Other Environment Variables
Right now, our program only uses one other environment variable, which can be found in the bin/www file:
#!/usr/bin/env node
importappfrom'../app.js';
importloggerfrom'../configs/logger.js';
importhttpfrom'http';
/**
* Get port from environment and store in Express.
*/varport=normalizePort(process.env.PORT||'3000');
app.set('port', port);
// -=-=- other code omitted here -=-=-
The code process.env.PORT || '3000' is a commonly used shorthand in JavaScript to check for the presence of a variable. Basically, if process.env.PORT is set, then that code will resolve to that value. If not, then the or operator || will use the second option, which is the value '3000' that is just hard-coded into our application.
So, we can set that value explicitly in our .env file:
LOG_LEVEL=debug
PORT=3000
In general, it is always good practice to explicitly list all configurable values in the .env file when developing an application, since it helps us keep track of them.
However, each value should also have a logical default value if no configuration is provided. Ideally, our application should be able to run correctly with minimal configuration, or it should at least provide clear errors to the user when a configuration value is not provided. For example, we can look back at the level() function in configs/logger.js to see that it will set the logging level to http if it cannot find an appropriate LOG_LEVEL environment variable.
Environment Variable Security
Storing the configuration for our application in a .env file is a great option, and it is even included as item 3 of the twelve-factor methodology for developing modern web applications.
Unfortunately, this can present one major security flaw - often, the information stored in the .env file is very sensitive, since it may include database passwords, encryption keys, and more. So, we want to make absolutely sure that our .env file is never committed to git or GitHub, and it should never be shared between developers.
We can enforce this by ensuring that our .gitignore file inside of our server folder includes a line that prevents us from accidentally committing the .env file. Thankfully, both the .gitignore produced by the Express application generator, as well as the one in the GitHub gitignore repository both already include that line.
Instead, it is common practice to create a second file called .env.example (or similar) that contains a list of all configurable environment variables, along with safe default values for each. So, for this application, we might create a .env.example file that looks like this:
LOG_LEVEL=http
PORT=3000
This file can safely be committed to git and stored in GitHub. When a new developer or user clones our project, they can easily copy the .env.example file to .env and update it to match their desired configuration.
As we continue to add environment variables to our .env file, we should also make sure the .env.example file is kept up to date.
This is a good point to commit and push our work, but be extra sure that our .env file DOES NOT get committed to git!
There are many different ways to document the features of a RESTful web application. One of the most commonly used methods is the OpenAPI Specification (OAS). OpenAPI was originally based on the Swagger specification, so we’ll sometimes still see references to the name Swagger in online resources.
At its core, the OpenAPI Specification defines a way to describe the functionality of a RESTful web application in a simple document format, typically structured as a JSON or YAML file. For example, we can find an example YAML file for a Petstore API that is commonly cited as an example project for understanding the OpenAPI Specification format.
That file can then be parsed and rendered as an interactive documentation website for developers and users of the API itself. So, we can find a current version of the Petstore API Documentation online and compare it to the YAML document to see how it works.
For more information on the OpenAPI Specification, consult their Getting Started page.
Configuration OpenAPI
For our project, we are going to take advantage of two helpful libraries to automatically generate and serve OpenAPI documentation for our code using documentation comments:
swagger-jsdoc - generates OpenAPI Specification based on JSDoc comments.
swagger-ui-express - serves an OpenAPI Documentation page based on the specification generated by other tools.
First, let’s install both of those libraries into our project:
$ npm install swagger-jsdoc swagger-ui-express
Next, we should create a configuration file for the swagger-jsdoc library that contains some basic information about our API. We can store that in the configs/openapi.js file with the following content:
Let’s look at a few items in this file to see what it does:
url() - this function checks for the OPENAPI_HOST environment variable. If that is set, then it will use that value. Otherwise, it uses a sensible default value of http://localhost:3000 or whatever port is set in the environment.
options - the options object is used to configure the swagger-jsdoc library. We can read more about how to configure that library in the documentation. At a minimum, it provides some basic information about the API, as well as the URL where the API is located, and a list of source files to read information from. For now, we only want to read from the routes stored in the routes folder, so we include that path along with a wildcard filename.
We should also take a minute to add the OPENAPI_HOST environment variable to our .env and .env.example files. If we are running our application locally, we can figure out what this value should be pretty easily (usually it will look similar to http://localhost:3000 or similar). However, when we are running in GitHub Codespaces, our URL changes each time. Thankfully, we can find all the information we need in the environment variables provided by GitHub Codespaces (see the previous page for a full list).
So, the item we need to add to our .env file will look something like this:
This is one of the key features of the dotenvx library we are using - it will expand environment variables based on the existing environment. So, we are using the values stored in the CODESPACE_NAME, PORT, and GITHUB_CODESPACES_PORT_FORWARDING_DOMAIN environment variables to construct the appropriate URL for our application.
In our .env.example file, we might want to make a note of this in a comment, just to be helpful for future developers. Comments in the .env file format are prefixed with hashes #.
LOG_LEVEL=debug
PORT=3000OPENAPI_HOST=http://localhost:3000
# For GitHub Codespaces# OPENAPI_HOST=https://$CODESPACE_NAME-$PORT.$GITHUB_CODESPACES_PORT_FORWARDING_DOMAIN
Once that configuration is created, we can add it to our app.js file, along with a few lines to actually make the documentation visible:
Notice that we are using the OPENAPI_VISIBLE environment variable to control whether the documentation is visible or not, and we print a warning to the terminal if it is enabled. This is because it is often considered very insecure to make the details of our API visible to users unless that is the explicit intent, so it is better to be cautious.
Of course, to make the documentation appear, we’ll have to set the OPENAPI_VISIBLE value to true in our .env file, and also add a default entry to the .env.example file as well:
Now, let’s run our application and see what happens:
$ npm run dev
We should see the following output when our application initializes:
> example-project@0.0.1 dev
> nodemon ./bin/www

[nodemon] 3.1.9
[nodemon] to restart at any time, enter `rs`
[nodemon] watching path(s): *.*
[nodemon] watching extensions: js,mjs,cjs,json
[nodemon] starting `node ./bin/www`
[dotenvx@1.34.0] injecting env (4) from .env
[2025-01-25 09:10:37.646 PM] warn:      OpenAPI documentation visible!
[2025-01-25 09:10:37.649 PM] info:      Listening on port 3000
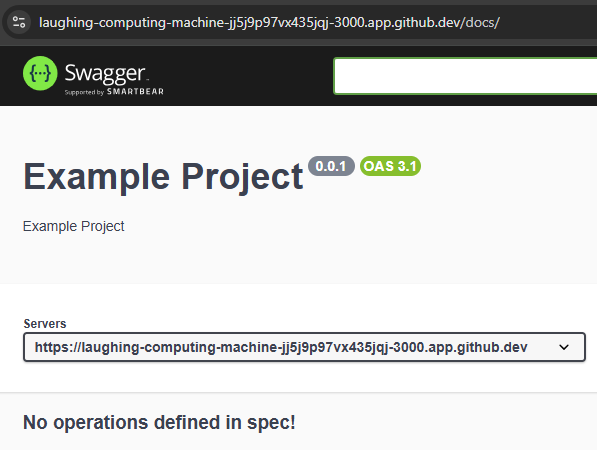
Now, let’s load our application in a web browser, and go to the /docs path. We should see our OpenAPI Documentation website!
Notice that the Servers URL matches the URL at the top of the page! That means our complex OPENAPI_HOST environment variable is working correctly.
However, we notice that our server does not have any operations defined yet, so we need to add those before we can really make use of this documentation website.
Documenting Routes
To document our routes using the OpenAPI Specification, we can add a simple JSDoc comment above each route function with some basic information, prefixed by the @swagger tag.
/**
* @swagger
* tags:
* name: index
* description: Index Routes
*/importexpressfrom'express';
constrouter=express.Router();
/**
* @swagger
* /:
* get:
* summary: index page
* description: Gets the index page for the application
* tags: [index]
* responses:
* 200:
* description: success
*/router.get('/', function(req, res, next) {
res.render('index', { title:'Express' });
});
exportdefaultrouter;
/**
* @swagger
* tags:
* name: users
* description: Users Routes
*/importexpressfrom'express';
constrouter=express.Router();
/**
* @swagger
* /users:
* get:
* summary: users list page
* description: Gets the list of all users in the application
* tags: [users]
* responses:
* 200:
* description: a resource
*/router.get('/', function(req, res, next) {
res.send('respond with a resource');
});
exportdefaultrouter;
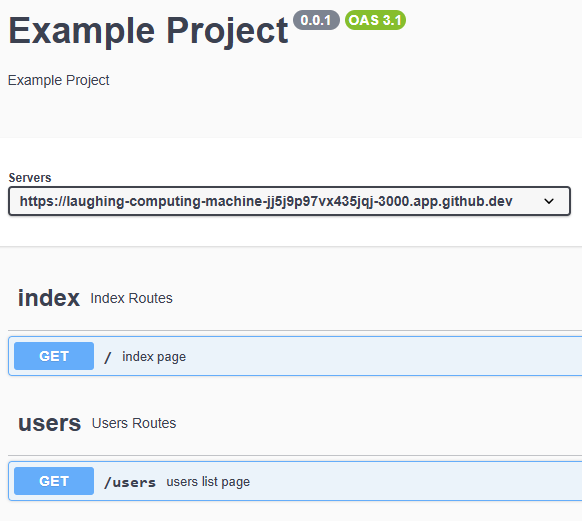
Now, when we run our application and view the documentation, we see two operations:
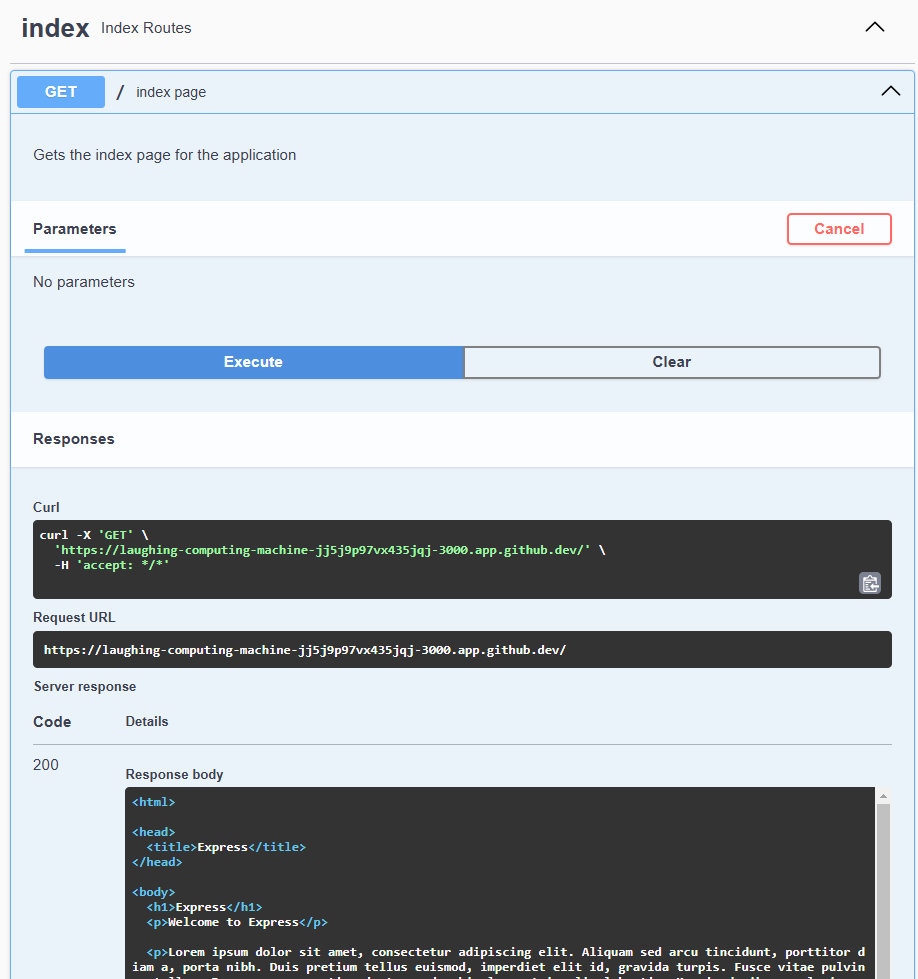
We can expand the operation to learn more about it, and even test it on a running server if our URL is set correctly:
As we develop our RESTful API, this documentation tool will be a very powerful way for us to understand our own API’s design, and it will help us communicate easily with other developers who wish to use our API as well.
It is also considered good practice to add additional documentation to all of the source files we create for this application. One common standard is JSDoc, which is somewhat similar to the JavaDoc comments we may have seen in previous courses. JSDoc can be used to generate documentation, but we won’t be using that directly in this project. However, we will be loosely following the JSDoc documentation standard to give our code comments some consistency. We can find a full list of the tags in the JSDoc Documentation.
For example, we can add a file header to the top of each source file with a few important tags. We may also want to organize our import statements and add notes for each group. We can also document individual functions, such as the normalizePort function in the bin/www file. Here’s a fully documented and commented version of that file:
/**
* @file Executable entrypoint for the web application
* @author Russell Feldhausen <russfeld@ksu.edu>
*/// Import libraries
importhttpfrom'http';
// Import Express application
importappfrom'../app.js';
// Import logging configuration
importloggerfrom'../configs/logger.js';
// Get port from environment and store in Express
varport=normalizePort(process.env.PORT||'3000');
app.set('port', port);
// Create HTTP server
varserver=http.createServer(app);
// Listen on provided port, on all network interfaces
server.listen(port);
// Attach event handlers
server.on('error', onError);
server.on('listening', onListening);
/**
* Normalize a port into a number, string, or false.
*
* @param {(string|number)} val - a value representing a port to connect to
* @returns {(number|string|boolean)} the port or `false`
*/functionnormalizePort(val) {
varport= parseInt(val, 10);
if (isNaN(port)) {
// named pipe
returnval;
}
if (port>=0) {
// port number
returnport;
}
returnfalse;
}
/**
* Event listener for HTTP server "error" event.
*
* @param {error} error - the HTTP error event
* @throws error if the error cannot be determined
*/functiononError(error) {
if (error.syscall!=='listen') {
throwerror;
}
varbind=typeofport==='string'?'Pipe '+port:'Port '+port;
// handle specific listen errors with friendly messages
switch (error.code) {
case'EACCES':logger.error(new Error(bind+' requires elevated privileges'));
process.exit(1);
break;
case'EADDRINUSE':logger.error(new Error(bind+' is already in use'));
process.exit(1);
break;
default:throwerror;
}
}
/**
* Event listener for HTTP server "listening" event.
*/functiononListening() {
varaddr=server.address();
varbind=typeofaddr==='string'?'pipe '+addr:'port '+addr.port;
logger.info('Listening on '+bind)
}
Here is another example of a cleaned up, reorganized, and documented version of the app.js file. Notice that it also includes an @export tag at the top to denote the type of object that is exported from this file.
/**
* @file Main Express application
* @author Russell Feldhausen <russfeld@ksu.edu>
* @exports app Express application
*/// Load environment (must be first)
import'@dotenvx/dotenvx/config';
// Import libraries
importcompressionfrom'compression';
importcookieParserfrom'cookie-parser';
importexpressfrom'express';
importhelmetfrom'helmet';
importpathfrom'path';
importswaggerUifrom'swagger-ui-express'// Import configurations
importloggerfrom'./configs/logger.js';
importopenapifrom'./configs/openapi.js'// Import middlewares
importrequestLoggerfrom'./middlewares/request-logger.js';
// Import routers
importindexRouterfrom'./routes/index.js';
importusersRouterfrom'./routes/users.js';
// Create Express application
varapp=express();
// Use libraries
app.use(helmet());
app.use(compression());
app.use(express.urlencoded({ extended:false }));
app.use(cookieParser());
app.use(express.json());
// Use middlewares
app.use(requestLogger);
// Use static files
app.use(express.static(path.join(import.meta.dirname, 'public')));
// Use routers
app.use('/', indexRouter);
app.use('/users', usersRouter);
// Use SwaggerJSDoc router if enabled
if (process.env.OPENAPI_VISIBLE==='true') {
logger.warn('OpenAPI documentation visible!');
app.use('/docs', swaggerUi.serve, swaggerUi.setup(openapi, {explorer:true}));
}
exportdefaultapp;
Finally, here is a fully documented routes/index.js file, showing how routes can be documented both with JSDoc tags as well as OpenAPI Specification items:
/**
* @file Index router
* @author Russell Feldhausen <russfeld@ksu.edu>
* @exports router an Express router
*
* @swagger
* tags:
* name: index
* description: Index Routes
*/// Import libraries
importexpressfrom"express";
// Create Express router
constrouter=express.Router();
/**
* Gets the index page for the application
*
* @param {Object} req - Express request object
* @param {Object} res - Express response object
* @param {Function} next - Express next middleware function
*
* @swagger
* /:
* get:
* summary: index page
* description: Gets the index page for the application
* tags: [index]
* responses:
* 200:
* description: success
*/router.get('/', function(req, res, next) {
res.render('index', { title:'Express' });
});
exportdefaultrouter;
Now is a great time to document all of the JavaScript files in our application following the JSDoc standard.
Finally, let’s look at two other tools that will help us write clean and maintainable JavaScript code. The first tool is eslint, which is a linting tool to find bugs and issues in JavaScript code by performing some static analysis on it. This helps us avoid any major issues in our code that can be easily detected just by looking at the overall style and structure of our code.
To begin, we can install eslint following the recommended process in their documentation:
$ npm init @eslint/config@latest
It will install the package and ask several configuration questions along the way. We can follow along with the answers shown in the output below:
Need to install the following packages:
@eslint/create-config@1.4.0
Ok to proceed? (y) y

@eslint/create-config: v1.4.0

✔ How would you like to use ESLint? · problems
✔ What type of modules does your project use? · esm
✔ Which framework does your project use? · none
✔ Does your project use TypeScript? · javascript
✔ Where does your code run? · node
The config that you've selected requires the following dependencies:

eslint, globals, @eslint/js
✔ Would you like to install them now? · No / Yes
✔ Which package manager do you want to use? · npm
☕️Installing...

added 70 packages, and audited 273 packages in 5s

52 packages are looking for funding
  run `npm fund` for details

found 0 vulnerabilities
Successfully created /workspaces/example-project/server/eslint.config.js file.
Once it is installed, we can run eslint using the following command:
$ npx eslint --fix .
When we do, we’ll probably get a couple of errors:
/workspaces/example-project/server/routes/index.js
  35:36  error  'next' is defined but never used  no-unused-vars

/workspaces/example-project/server/routes/users.js
  35:36  error  'next' is defined but never used  no-unused-vars

✖ 2 problems (2 errors, 0 warnings)
In both of our routes files, we have included the next parameter, but it is unused. We could remove it, but it is often considered good practice to include that parameter in case we need to explicitly use it. So, in our eslint.config.js we can add an option to ignore that parameter (pay careful attention to the formatting; for some reason the file by default does not have much spacing between the curly braces):
Now we can just run this command to check our project for errors:
$ npm run lint
Formatting
Another commonly used tool for JavaScript developers is prettier. Prettier will reformat our JavaScript code to match a defined coding style, making it much easier to read and maintain.
First, let’s install prettier using npm as a development dependency:
$ npm install prettier --save-dev
We also need to create a .prettierrc configuration file that just contains an empty JavaScript object for now:
{}
There are many options that can be placed in that configuration file - see the Prettier Documentation for details. For now, we’ll just leave it blank.
We can now run the prettier command on our code:
$ npx prettier . --write
When we do, we’ll see output listing all of the files that have been changed:
Notice that nearly all of the files have been updated in some way. Many times it simply aligns code and removes extra spaces, but other times it will rewrite long lines.
Just like with eslint, let’s add a new script to package.json to make this process simpler as well:
With that script in place, we can clean up our code anytime using this command:
$ npm run format
Best Practice
Now that we have installed both eslint and prettier, it is always a good practice to run both tools before committing any code to git and pushing to GitHub. This ensures that your codebase is always clean, well formatted, and free of errors or bugs that could be easily spotted by these tools.
In this example project, we created an Express application with the following features:
GitHub Codespaces
A sample Express application
Updated to ES Modules
Application logs with Winston and Morgan
Other useful libraries such as Compression and Helmet
A better development server using Nodemon
Environment variables through Dotenvx
Code documentation with JSDoc and OpenAPI comments
Linting and Formatting with ESLint and Prettier
This example project makes a great basis for building robust RESTful web APIs and other Express applications.
As you work on projects built from this framework, we welcome any feedback or additions to be made. Feel free to submit requests to the course instructor for updates to this project.