Chapter 3
Design
Let’s come up with a plan!
Let’s come up with a plan!
The second step in any kind of software development project should be to develop a plan of how the software should be built - ideally before any code is written. This is what design is all about. This is also the antithesis to cowboy coding which is likely how you learned to program. Working on a software system without a clear plan lies at the heart of many software project failures.
This section will examine in detail how such plans are developed and documented.
Some key terms in this chapter are:
The outcome of the design phase is a design document. It provides a design, or specification, for a software system. You can think of it like an architect’s blueprints provide the details for construction tradesmen to build a building - it provides rich enough direction that skilled laborers can follow in carrying out their portion of the work. In the waterfall model, the design document fulfills a similar role - it allows the work of building a software system to be broken down and assigned to different programmers focusing on a specific aspect of the system. If they follow the specification in the design, then the code created by each of these programmers works cohesively to create a viable program.
On the other hand, if the document lacks sufficient detail, or the programmers disregard aspects of the design and substitute their own ideas, the overall program will be compromised. Returning to the building metaphor, one of the classrooms in our department was originally built with the projection screen deploying over the exit door - a clear case of either 1) lack of detail in the plans, or 2) an installer not following them.
As you can imagine, a design document can grow quite large. To help combat this, Unified Modeling Language (UML) and other modeling approaches have been developed to convey design aspects visually, allowing the text of the document to focus on conveying key details. You’ve already worked with many UML diagrams and specifications in your education - most of your early programming assignments were essentially specifications. We’ll review those (and possibly introduce a few more) next.
To put it succinctly, a UML Class Diagram represents the classes and the associations between the classes in an object-oriented program. Each class is represented by a separate box, and the associations between classes by arrows. The intent of the class diagram is to represent the complete structure (but not behavior) of an object-oriented program. This allows individual programmers to focus only a small part of the overall program - a class and the classes it has associations with. Combined with the other information contained in the design document, the programmer can implement their piece of the program and it should ‘just work’ when combined with the code written by other programmers.
classDiagram
  Bear <|-- AnimatedBear
  class Bear{
    <<abstract>>
    +name string
    growl()* string
  }
  class AnimatedBear{
    +growl() string
    +dance()
}In a UML class diagram, visibility (public/protected/private) is specified with symbols:
The boxes representing a class are divided into three compartments. The first compartment displays the class identity, the second its attributes (fields), and the third its operations (methods).
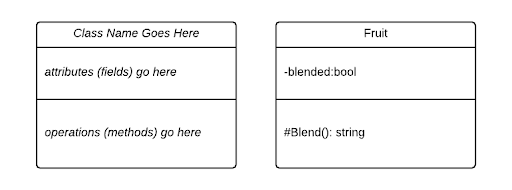
Each element in a compartment appears in its own line, and uses the format described below.
The class identity is its name (again, capitalization matters). We can optionally preface it with a visibility symbol (if unmarked, we assume public). If the class is abstract, it should be italicized, and if it is static, it should be underlined.
The attributes represent the state of the objects, i.e. its variables. These may use different names based on what programming language you are modeling (i.e. fields, properties, instance variables), but if it holds state, this is where it goes. These are represented by typed elements using the pattern:
$$[visibility] name : type [constraint]$$The optional $[visibility]$ details the visibility of the element using the symbols described above.
The $name$ is the element’s name, and should be exact (i.e. capitalization matters). If the element is abstract, its name should be italicized. If it is static, the name should be underlined.
The $type$ is the element’s type (i.e. float/int/bool).
Finally, the $[constraint]$ any optional constraints, expressed in a pair of curly braces after the element.
For example:
$$+ weight: int \{weight: >= 0\}$$Indicates a public field named weight of type int whose value should be zero or greater.
The operators represent the behavior of the object, i.e. its methods. These are specified using the format:
$$visibility name([parameter list]) : [return type]$$The $visibility$ details the visibility of the operator (i.e. public/private/protected). Visibility is expressed using symbols described above.
The $name$ is the operator’s name, and should be exact (i.e. capitalization matters). If the operator is abstract, its name should be italicized. If it is static, the name should be underlined.
The $[parameter list]$ is a comma-delineated list of operators in the form:
$$name: type$$Finally, the $[return type]$ is the element’s type (i.e. float/int/bool). If it can be omitted if the return type is void or undefined.
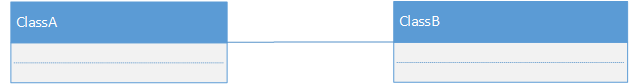
The association (the relationship) between classes are specified by arrows between the class boxes. The format of the arrow, along with its direction, conveys details about the association.
Associations are classified as being has-a or is-a and weak or strong. The four combinations are therefore:
| Association | Type | Representation |
|---|---|---|
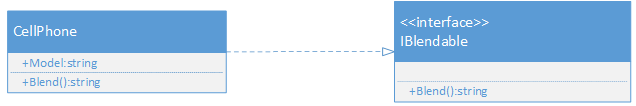
| Realization | weak is-a | dashed arrow |
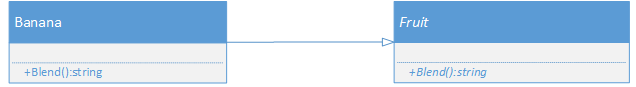
| Generalization | strong is-a | solid arrow |
| Aggregation | weak has-a | open diamond fletching |
| Composition | strong has-a | filled diamond fletching |
The arrow is always in the direction of the relationship, i.e. from the class that has-a instance of the other class to that class, and from the class that is-a instance of another class to that class.
Realization makes an interface or abstract class “real” by implementing its methods. We call this weak because the interface or abstract class does not provide functionality to the implementing class.
Generalization refers to extracting the parts that classes have in common and “generalizing” them into a base class. You probably know this relationship as inheritance. We call this a strong relationship because the base class provides functionality to the derived class.
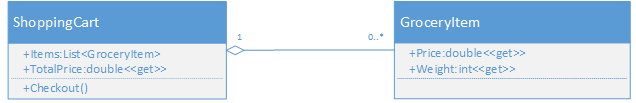
Aggregation refers to one class holding references to another one - i.e. through a field of that type, or a collection of that type. It is a weak association because the object the aggregated object or objects can be swapped for other instances (or left null).
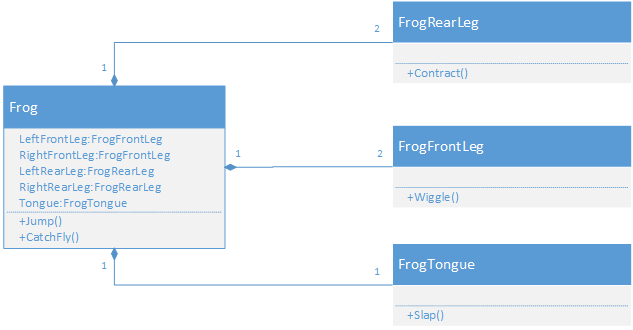
Composition also refers to one class holding references to another one. The difference is that with composition, those other object instances are typically created at the same time as the containing object, and are never swapped out for other instances. You can think of the whole group as a single object, even though it is multiple separate ones.
UML was intended to represent a generic object-oriented language. However, it was recognized that many languages have specific features not found in others. To allow UML to represent these, it also includes the idea of stereotypes - specifying language-specific features using a pair of angled brackets:
$$\langle\langle stereotype \rangle\rangle$$For example, in C# properties are accessor methods (a get and/or set) which are treated as fields. We can represent this by applying a stereotype to a field, i.e.:
$$+Count:int \langle\langle get \rangle\rangle$$Indicates the property Count has a get but no set method.
You can learn more about UML class diagrams by reviewing the CIS 400 textbook, visiting the official UML website, or by reading some of the textbooks in the O'Riley For Higher Education library.
Most production applications today utilize structured data that is commonly stored using a specialized application known as a database. For traditional relational databases, a number of modeling approaches have been developed, including UML database diagrams, Entity Relationship diagrams, and Crows-foot notation. The purposes behind these modeling approaches is similar to that of the UML Class Diagram - a database model allows its readers to 1) quickly set up the database structure and 2) understand how to access the needed information (i.e. how to author SQL queries to obtain the needed data).
This also means that the database design can be done by a separate team than the one building the program that will making use of the database. Thus, the structure of the database can be developed by experts in database design with an eye towards efficient modeling, storage and information retrieval, while the actual programmers using the database only need to be able to write queries. If the necessary queries are identified as stored procedures as part of the design document, then even less knowledge is needed on the part of the programmers - the stored procedures can be written by the database architects, and the programmers only need to know how to call them.
You can review database diagrams by reviewing chapters 9 and 10 in the CC 520 textbook, visiting the official UML website, or by reading some of the textbooks in the O'Riley For Higher Education library.
A UX (for user experience, aka user interface) diagram visually presents what the user sees on the screen of a device running the program in a simplified form. These are also sometimes called wireframes (due to the diagram typically only showing text and outlines of controls) or bluelines (a term borrowed from architecture, where plans are drawn in blue pencil before begin printed in black and white). Typically, each screen of the user interface is drawn as a UX diagram, along with a description of the purpose of the controls on the page.
In addition to displaying individual screens in a UX, arrows can be added connecting screens to represent how the program’s state advances based on user interaction. The actions the user takes are typically used as a label for these arrows. Increasingly, UX modeling applications are employed to provide an interactive ‘click-through’ experience of the app, though most of these tools will also print a traditional diagram form.
UX diagrams provide several benefits. While most customers won’t understand other aspects of the design document, a UX diagram represents the part of the program they will be interacting with. Accordingly, this is the portion of the design they will be able to give the most feedback for - and that feedback may influence other aspects of the design. Second, to design a good UX, a developer must understand the customers’ needs and way of thinking about a problem – essentially, they must be familiar with the customers’ processes and discipline. With a good UX diagram, however, this understanding is not vital. As long as the UX designer understood the customers’ needs and captured it in the UX diagram, the user interface it specifies will make sense to the customer. The programmer need only implement it.