Inspecting Behavior
We may also wish to inspect the behavior of our program that could lead to a particular error. Specifically, we may need to know what set of function calls and classes lead to the error itself. In that case, we’ll need a way to see what code was executed before the bug was reached.
Stack Trace
One of the most useful ways to inspect the behavior of our application is to look at the call stack or stack trace of the program when it reaches an exception. The call stack will list all of the functions currently being executed, even including the individual line numbers of the currently executed piece of code.
For example, consider this code:
public class Test {

    public void functionA() throws Exception{
        this.functionB();
    }

    public void functionB() throws Exception{
        this.functionC();
    }

    public void functionC() throws Exception{
        throw new Exception("Test Exception");
    }

    public static void main(String[] args) throws Exception{
        Test test = new Test();
        test.functionA();
    }
}
class Test:
def function_a(self) -> None:
self.function_b()
def function_b(self) -> None:
self.function_c()
def function_c(self) -> None:
raise Exception("Test Exception")
Test().function_a()This code includes a chain of three functions, and the innermost function will throw an exception. When we run this code, we’ll get the following error messages:
Exception in thread "main" java.lang.Exception: Test Exception
        at Test.functionC(Test.java:12)
        at Test.functionB(Test.java:8)
        at Test.functionA(Test.java:4)
        at Test.main(Test.java:17)
Traceback (most recent call last):
File "Test.py", line 11, in <module>
Test().function_a()
File "Test.py", line 3, in function_a
self.function_b()
File "Test.py", line 6, in function_b
self.function_c()
File "Test.py", line 9, in function_c
raise Exception("Test Exception")
Exception: Test ExceptionAs we can see, both Java and Python will automatically print a stack trace of the exact functions and lines of code that we executed when we were reaching the error. Recall that this relates to the call stack in memory that is created while this program is executed:
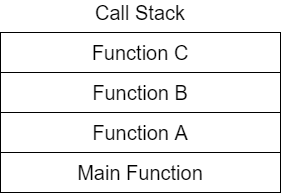
As we can see, Java will print the innermost call at the top of the call stack, whereas Python will invert the order and put the innermost call at the end. So, you’ll have to read carefully to make sure you are interpreting the call stack correctly.
What if we want to get a call stack without crashing our program? Both Java and Python support a method for this:
Thread.dumpStack();traceback.print_stack()In both instances, we just need to import the appropriate library, and we have a method for examining the complex behaviors of our programs at our fingertips. Of course, as we’ll see in a bit, both debuggers and loggers can be used in conjunction with these methods to get even more information from our program.