Debuggers
What if we want to have a bit more control over our programs and use a more powerful tool for finding bugs. In that case, we’ll need to use a debugger. A debugger is a special application that allows us to inspect another program while it is running. Using a debugger, we can inspect both the state and behavior of an application, and observe the program directly while it runs. Most debuggers can also be configured to pause a program at a particular line of code, and then execute each following line one at a time to quickly find the source of the error. Both Java and Python come with debuggers that we can use.
Standalone Debuggers
In practice, very few developers use a debugger in a standalone way as described below. Instead, typically the debugger is part of their integrated development environment, or IDE. Using a debugger in an IDE is much simpler than using it via the terminal. At the bottom of this page, we’ll describe how to use the built-in debugger in Codio, which will be a much simpler experience.
Java Debugger
The Java debugger jdb is a core part of the Java Software Development Kit (SDK), and is already installed for us in Codio. To use the Java debugger, we have to perform two steps:
- When we execute our Java program, we must provide a special command-line argument to enable debugging. An example would be
-agentlib:jdwp=transport=dt_shmem,server=y,suspend=n - Then, once our program is running, we can open the Java debugger in a separate Terminal window using
jdb -attach jdbconn
Once we’ve started a Java debugger session, we can use several commands to control the application. The Java Debugger manual from Oracle gives a good overview of how to use the application.
Python Debugger
Python also includes a debugger, called pdb. It can be imported as a library within the code itself, or it can be used as a module when running another script. Similar to the Java debugger, once the debugger is launched, there are many different commands we can use to control the application. The Python Debugger documentation is a great source of information for how to use the Python debugger itself.
Codio Debugger
Of course, as you might guess, using a debugger directly on the terminal is a very complex, time-consuming, and painful process. Thankfully, most modern integrated development environments, or IDEs, include a graphical interface for various debuggers, and Codio is no exception. Codio includes a built-in debugger that is capable of debugging both Java and Python code.
The Codio Documentation is a great place to learn about how to use the Codio debugger and all of the features it provides. In the example project for this module, we’ll also learn how to quickly integrate a debugger into our larger project in Codio.
Once the Codio debugger is launched, you’ll be given a view similar to this one:
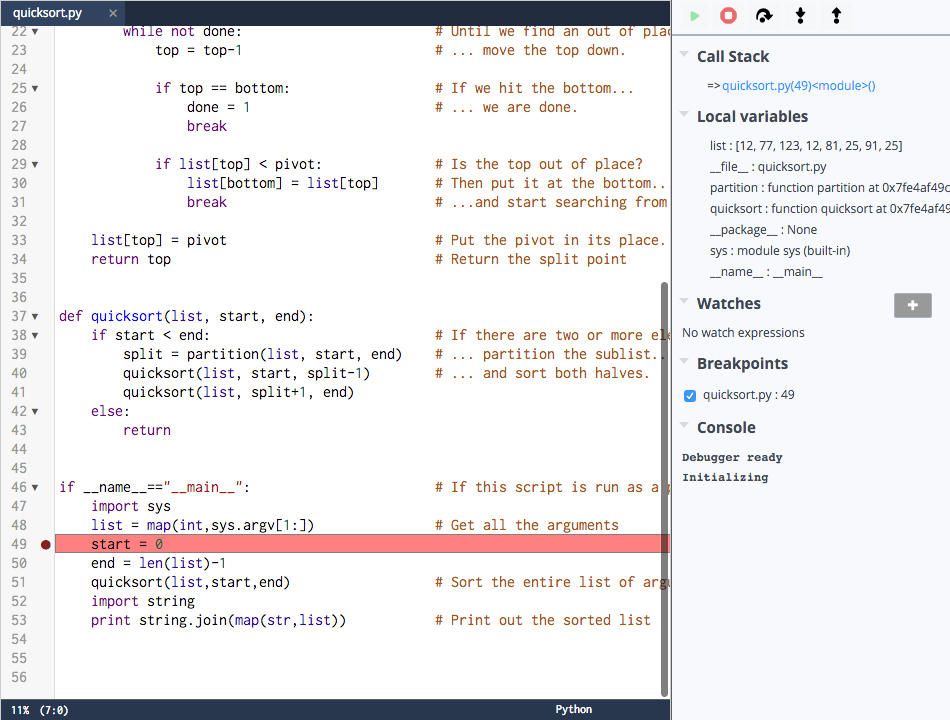
On the right, we can see the debugging window that lists the current call stack, any local variables that are visible, as well as watches and breakpoints. A breakpoint is a line of code that we’ve marked in the debugger that causes execution to stop, or break, when it reaches that line. Basically, we are telling the debugger that we’d like to execute the program up to that point. Once the program is paused, we can examine the state and call stack, and decide how we’d like to proceed. There are 5 buttons at the top of the debugger panel, and they are described in the Codio documentation2 as follows:
- Resume - this tells the debugger to carry on execution without stopping until another breakpoint is encountered.
- Stop - execution will stop and the debug window will be closed.
- Step over - the debugger will execute the next line of code and then stop. If the line of code about to be executed is a function, then it will execute the contents of that function but will not stop within it unless the function contains a breakpoint.
- Step into - the debugger will execute the next line of code and then stop. If the line of code about to be executed is a function, then it will stop on the first line within that function.
- Step out - the debugger will exit the current function and stop on the next line of the calling function. If the current line is the main entry function of the application then execution will cease but and the debugger will restart automatically.
These five buttons are common to most debuggers, so it is very important to get used to them and how they work. Stepping through your code quickly and efficiently using breakpoints and a debugger is an excellent skill to learn!
Standard Input for Debugging
Unfortunately, one major limitation of the Codio debugger is that it does not allow us to accept input via the terminal while the debugger is running. So, we’ll have to come up with some other way of providing input to our program if we need to debug it.
The easiest way is to write our program to read input from a file where needed. We can then provide the file name as a command-line argument when the program is launched via the debugger. In our code, if a command-line argument is provided, we know we should read from a file. Otherwise, we should just read from the terminal like usual.
We’ve seen how to do this in our code in many of the previous CC courses, so feel free to go back and review some of that code for examples. We’ll also look at how to do this in the example project for this module.